3. Median Household Income
links:
introduction (1)
race (2)
SAT scores (6)
other education (7)
conclusion (9)
all maps (10)
all scatter plots (11)
bibliography (12)
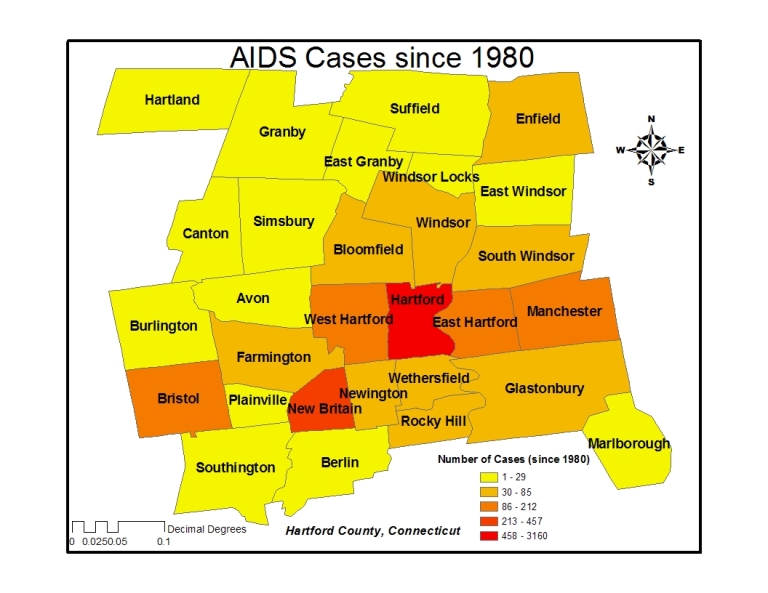
The makeup of Hartford County is fairly interesting: on the one hand, there are many small, middle to upper class suburban towns, one of which is my hometown of West Hartford. Most of these exhibit less than 50 cumulative AIDS cases since 1980, and therefore have low AIDS rates. Conversely, there are many notoriously poorer towns and small cities: Hartford itself, New Britain, East Hartford, Bristol, and Manchester, each which have seen well over 100 cases (See Table 1.3). Having some awareness of the basic geography of the area is essential in evaluating the distribution of AIDS cases in relation to economic factors.

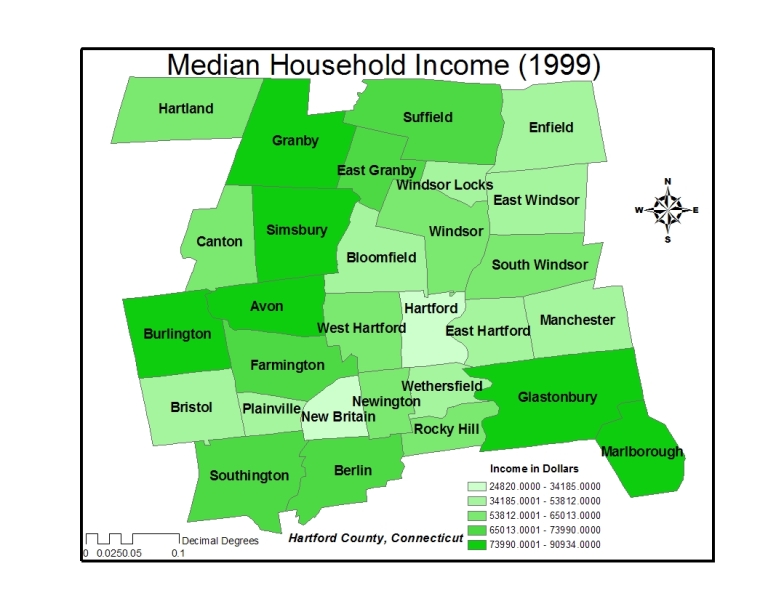
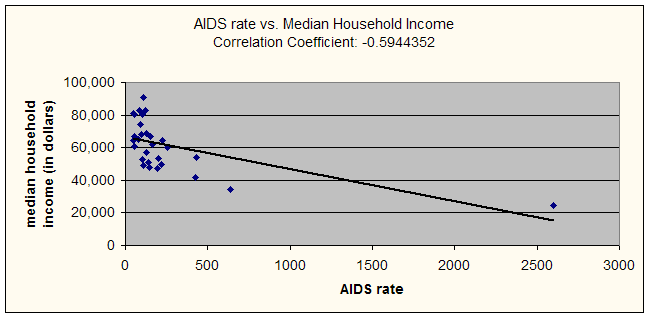
Beginning with median household income (1999) from the Census Bureau for each of the towns, there seemed to be a fair range, from around $40,000 to $90,000 in which 27 out of 29 of the numbers fell. The correlation came out to -.60037833, which means that there is a converse relationship between AIDS rates and median household income. In other words, as median household income decreases, the AIDS rate increases.

It is evident from the scatter plot that there is one major outlier: the city of Hartford, whose median household income is $24,820. (In addition to, perhaps, a less noteworthy outlier in New Britain at $34,185).

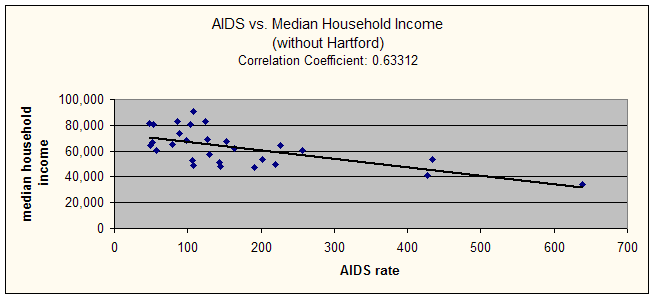
When the Hartford data was excluded from the scatter plot, the correlation remained negative, though it became a little bit stronger, at -0.6331184.

It was evident from the first paper which towns in Hartford County had
the highest prevalence of AIDS, and having lived in Hartford County for
most of my life, I had a general sense of the economic makeup and
poverty level of most towns. Based on that, the relationship between
AIDS rates and household income was not unexpected, although the degree
of significance might have been expected to be a little bit higher.