Introduction to Correlations
links:
race (2)
SAT scores (6)
other education (7)
conclusion (9)
all maps (10)
all scatter plots (11)
bibliography (12)
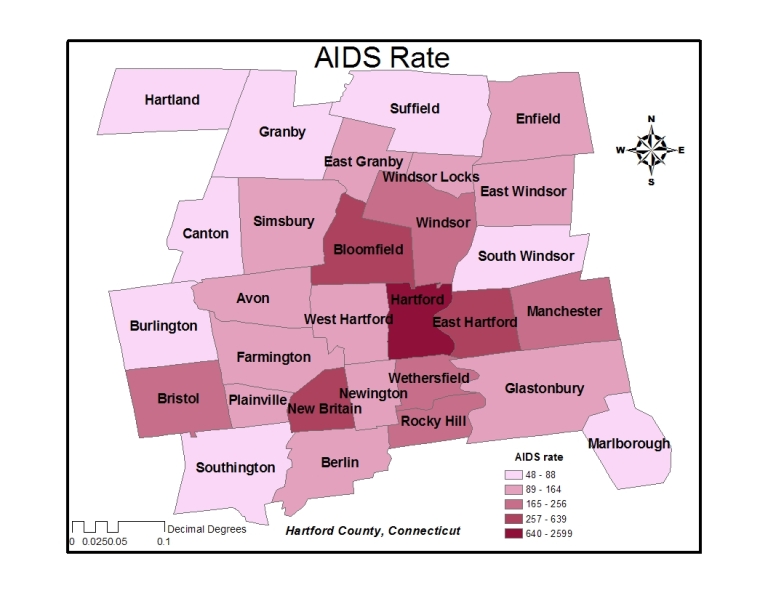
It is clear upon reflecting on the first paper that Hartford County has an AIDS problem. With that said, it was imperative to consider certain factors that contribute to the incidence of the disease in the county. By examining relationships between the AIDS rate in each of the towns in Hartford County and correlating them with several demographic factors, such as economics, education, and race, one can determine their relationship to the spread and distribution of the disease.
Hartford County consists of 29 towns. To determine if the factors are statistically significant with respect to their effect on the rate of AIDS, the number of towns in the sample (signified by “n”) minus 2, (n-2), 27 needs to be used. With a sample size of 27, a two-tailed probability of 0.05 (meaning that odds that the correlation is a chance occurrence are no more than 5 out of 100 times) is found at the absolute value of .381. Almost all of the correlations came out to be at or stronger than this 95% correlation level, meaning that those demographics are in fact very likely to be related in some way to the AIDS rate. However, correlation does not mean causation. Therefore, none of these variables have “caused” the AIDS rate to be such, they can only be said to have contributed to it.
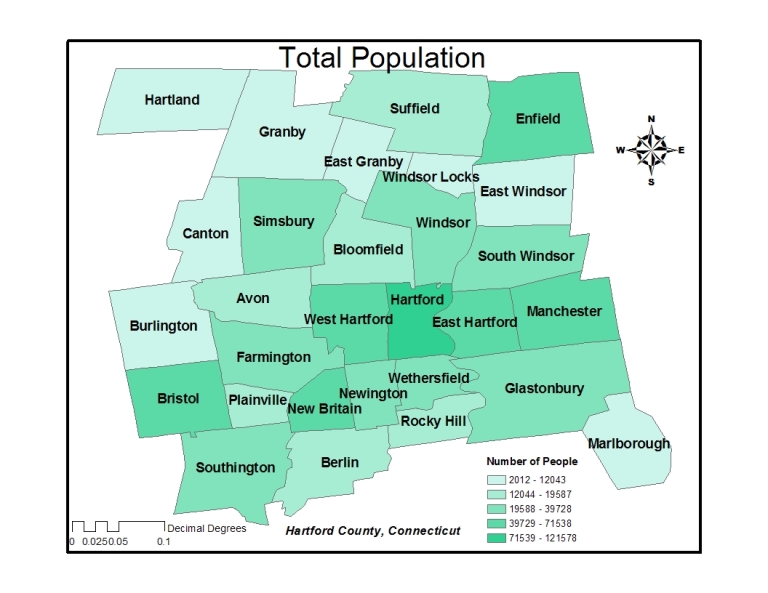
Hartford County, with a population of 857,183, has an AIDS rate of 556 cases per 100,000 people (Table 1.2), more than 200 cases per 100,000 people greater than the national average of 328.85 per 100,000 people. The AIDS rate in the city of Hartford alone is 2600 per 100,000 people, while in West Hartford it is only 163.55 per 100,000.