Statistics
Paper two presents a correlation analysis of Orange County, New York AIDS rates (cases per 100,000) with demographic information from the Census Bureau. My task in paper two is to search for demographics that would relate with AIDS numbers, or in other words find numbers that go together. The statistics, which are produced from the calculated AIDS rates and Census Bureau demographics, are the foundation for possible ideas to aid in the solving of Orange County’s problem of AIDS. Providing more information of the Orange County surroundings will help uncover problems, which might impact AIDS. Therefore, the correlation analysis consists of spreadsheets with calculated demographic percentages and correlation coefficients, graphs presenting an independent and dependent variable, and maps which visually illustrate demographics from the Census Bureau. Statistics allow us to refer to procedures that reduce data into a form that will allow us to draw conclusions from the data. Conclusions are based upon the p value, which entail that we have a certain amount of confidence that the independent variable is responsible for the difference we observe. The p value is based upon how the df, which is the amount of values subtracted by two. In my case, I have 32 values, therefore my df is 30. Therefore my p-values for 30 df is: 0.296 when a p-value = 0.10, 0.349 when a p-value = .05; 0.396 for a p=.025, and 0.449 for a p-value of .01. Although I discovered many stigmas that related with AIDS in the first paper, I was surprised to find even more in this paper. Below illustrates a map of the AIDS rate cases per 100,000 people by zip -code. The different colors symbolize five sets of AIDS rate ranges, which hold significance by observing that 339 is the average cumulative national rate.
| Zipcodes | Names | Total Population | Cumulative AIDS Cases | Rate per 100,000 |
| 10917 | Central Valley | 1653 | 4 | 242 |
| 10918 | Chester | 11609 | 115 | 991 |
| 10921 | Florida | 3982 | 9 | 226 |
| 10924 | Goshen | 12341 | 33 | 267 |
| 10925 | Greenwood Lake | 4853 | 11 | 227 |
| 10926 | Harriman | 3358 | 5 | 149 |
| 10928 | Highland Falls | 5353 | 13 | 243 |
| 10930 | Highland Mills | 7524 | 9 | 120 |
| 10940 | Middletown | 43033 | 202 | 469 |
| 10941 | Middletown | 13133 | 5 | 38 |
| 10950 | Monroe | 38766 | 33 | 85 |
| 10958 | New Hampton | 3081 | 17 | 552 |
| 10963 | Otisville | 4622 | 64 | 1385 |
| 10969 | Pine Island | 987 | 4 | 405 |
| 10987 | Tuxedo Park | 3204 | 3 | 94 |
| 10990 | Warwick | 19212 | 68 | 354 |
| 10992 | Washingtonville | 9033 | 15 | 166 |
| 10996 | West Point | 7115 | 3 | 42 |
| 10998 | Westtown | 3580 | 5 | 140 |
| 12518 | Cornwall | 6256 | 10 | 160 |
| 12520 | Cornwall on Hudson | 2928 | 5 | 171 |
| 12543 | Maybrook | 3146 | 5 | 159 |
| 12549 | Montgomery | 8736 | 9 | 103 |
| 12550 | Newburgh | 52024 | 277 | 532 |
| 12553 | New Windsor | 22672 | 34 | 150 |
| 12566 | Pine Bush | 11028 | 12 | 109 |
| 12577 | Salisbury Mills | 1751 | 4 | 228 |
| 12586 | Walden | 11497 | 15 | 130 |
| 12589 | Walkill | 13346 | 3 | 22 |
| 12729 | Cuddebackville | 1285 | 12 | 934 |
| 12746 | Hugenot | 1560 | 3 | 192 |
| 12771 | Port Jervis | 13475 | 28 | 208 |
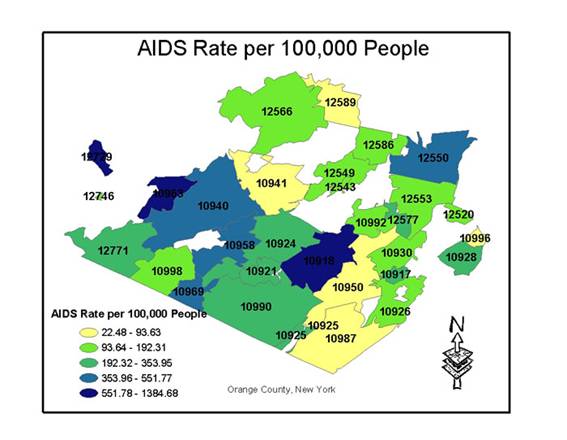
Orange County AIDS rate ranges from 22 in Walkill (12589) to 1385 in Otisville (10963). Even though many zip-codes do not exceed the national cumulative rate, there are seven zip-codes that posses a higher rate than the national cumulative rate. These seven zip-codes include Chester, Middletown, Otisville, Pine Island, Warwick, Newburgh, and New Hampton. Otisville (10963) has an astronomical rate. Throughout my paper, I will be referring to this town. Although I haven’t found any hard data yet, I’ve found a commonality between most of these locations. Most of these places contain prisons or correctional facilities. For example, Otisville has such a high rate because there it is a home of a federal prison. Do correctional facilities and AIDS rates establish a relationship?
Blacks, black males, above or at poverty line, male lack of education, and naturalized citizens were all positive significant correlations. These statistics highlight the unequal and misrepresented populations in Orange County. Although for most of my paper I mention that Otisville isn’t the average of Orange County, it is still part of it. Therefore it is essential that we find a solution for this prison population, and the rest of the troubled areas in Orange County.