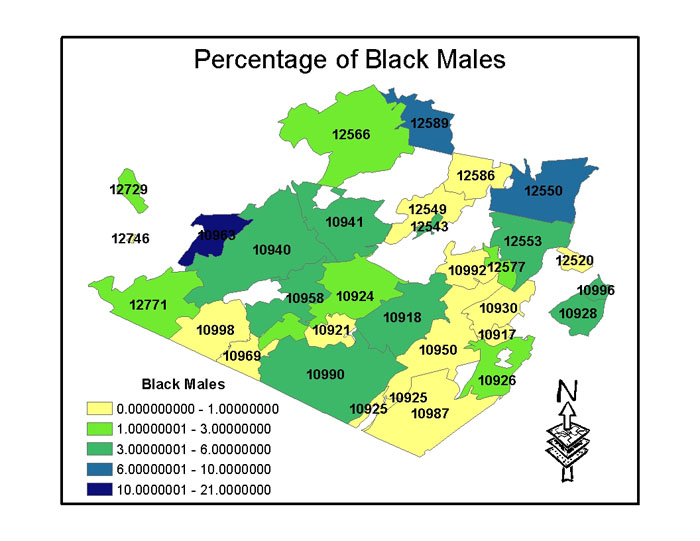
Lets Take an Even Closer Look With Blacks
| Zipcodes | Names | Total Population | Black_Male | Black_Male_% |
| 10917 | Central Valley | 1653.00 | 5.00 | 0.30 |
| 10918 | Chester | 11609.00 | 483.00 | 4.16 |
| 10921 | Florida | 3982.00 | 46.00 | 1.16 |
| 10924 | Goshen | 12341.00 | 430.00 | 3.48 |
| 10925 | Greenwood Lake | 4853.00 | 17.00 | 0.35 |
| 10926 | Harriman | 3358.00 | 63.00 | 1.88 |
| 10928 | Highland Falls | 5353.00 | 234.00 | 4.37 |
| 10930 | Highland Mills | 7524.00 | 72.00 | 0.96 |
| 10940 | Middletown | 43033.00 | 2304.00 | 5.35 |
| 10941 | Middletown | 13133.00 | 535.00 | 4.07 |
| 10950 | Monroe | 38766.00 | 346.00 | 0.89 |
| 10958 | New Hampton | 3081.00 | 159.00 | 5.16 |
| 10963 | Otisville | 4622.00 | 956.00 | 20.68 |
| 10969 | Pine Island | 987.00 | 6.00 | 0.61 |
| 10987 | Tuxedo Park | 3204.00 | 30.00 | 0.94 |
| 10990 | Warwick | 19212.00 | 806.00 | 4.20 |
| 10992 | Washingtonville | 9033.00 | 118.00 | 1.31 |
| 10996 | West Point | 7115.00 | 439.00 | 6.17 |
| 10998 | Westtown | 3580.00 | 28.00 | 0.78 |
| 12518 | Cornwall | 6256.00 | 43.00 | 0.69 |
| 12520 | Cornwall on Hudson | 2928.00 | 11.00 | 0.38 |
| 12543 | Maybrook | 3146.00 | 136.00 | 4.32 |
| 12549 | Montgomery | 8736.00 | 104.00 | 1.19 |
| 12550 | Newburgh | 52024.00 | 5078.00 | 9.76 |
| 12553 | New Windsor | 22672.00 | 809.00 | 3.57 |
| 12566 | Pine Bush | 11028.00 | 255.00 | 2.31 |
| 12577 | Salisbury Mills | 1751.00 | 29.00 | 1.66 |
| 12586 | Walden | 11497.00 | 90.00 | 0.78 |
| 12589 | Walkill | 13346.00 | 907.00 | 6.80 |
| 12729 | Cuddebackville | 1285.00 | 26.00 | 2.02 |
| 12746 | Hugenot | 1560.00 | 13.00 | 0.83 |
| 12771 | Port Jervis | 13475.00 | 323.00 | 2.40 |
| 0.5p=0.349 | 0.64 |
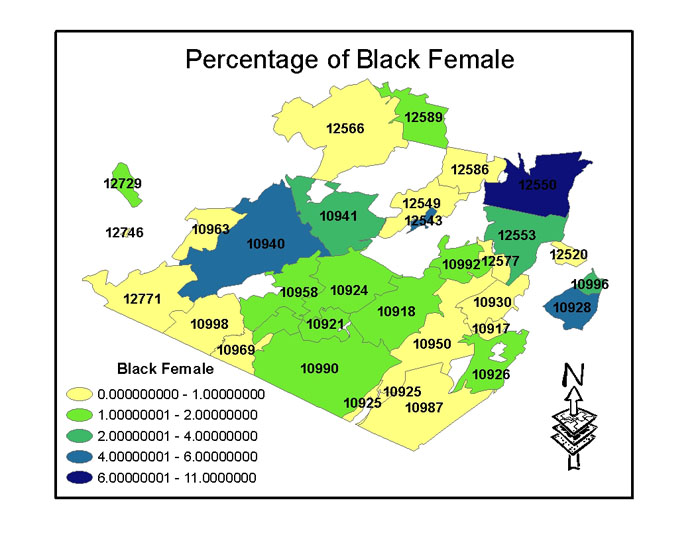
Lastly, I calculated the black female correlations. Before my calculations, I thought that black females would have a strong positive correlation just like the black males. Why would these females have a lesser relationship with the AIDS rates than the males? Also, my mom works in Planned Parenthood in Newburgh, and many of her female patients are black. I thought this observation would lead to a strong positive correlation. Based on my calculation, this observation is wrong because the black female correlation is +0.1254. Because black female correlation is so low, there is no p-value to determine the significance. Therefore we can conclude there is no relationship between black females and AIDS rates. Interestingly, the populations for black females in Otisville are very few, this helps address the population in the prisons.
| Zipcodes | Names | Total Population | Black_Female | Percentage |
| 10917 | Central Valley | 1653.00 | 5.00 | 0.30 |
| 10918 | Chester | 11609.00 | 252.00 | 2.17 |
| 10921 | Florida | 3982.00 | 75.00 | 1.88 |
| 10924 | Goshen | 12341.00 | 238.00 | 1.93 |
| 10925 | Greenwood Lake | 4853.00 | 21.00 | 0.43 |
| 10926 | Harriman | 3358.00 | 56.00 | 1.67 |
| 10928 | Highland Falls | 5353.00 | 244.00 | 4.56 |
| 10930 | Highland Mills | 7524.00 | 95.00 | 1.26 |
| 10940 | Middletown | 43033.00 | 2599.00 | 6.04 |
| 10941 | Middletown | 13133.00 | 542.00 | 4.13 |
| 10950 | Monroe | 38766.00 | 303.00 | 0.78 |
| 10958 | New Hampton | 3081.00 | 61.00 | 1.98 |
| 10963 | Otisville | 4622.00 | 49.00 | 1.06 |
| 10969 | Pine Island | 987.00 | 0.00 | 0.00 |
| 10987 | Tuxedo Park | 3204.00 | 35.00 | 1.09 |
| 10990 | Warwick | 19212.00 | 416.00 | 2.17 |
| 10992 | Washingtonville | 9033.00 | 157.00 | 1.74 |
| 10996 | West Point | 7115.00 | 253.00 | 3.56 |
| 10998 | Westtown | 3580.00 | 33.00 | 0.92 |
| 12518 | Cornwall | 6256.00 | 48.00 | 0.77 |
| 12520 | Cornwall on Hudson | 2928.00 | 3.00 | 0.10 |
| 12543 | Maybrook | 3146.00 | 144.00 | 4.58 |
| 12549 | Montgomery | 8736.00 | 81.00 | 0.93 |
| 12550 | Newburgh | 52024.00 | 5720.00 | 10.99 |
| 12553 | New Windsor | 22672.00 | 789.00 | 3.48 |
| 12566 | Pine Bush | 11028.00 | 109.00 | 0.99 |
| 12577 | Salisbury Mills | 1751.00 | 26.00 | 1.48 |
| 12586 | Walden | 11497.00 | 124.00 | 1.08 |
| 12589 | Walkill | 13346.00 | 209.00 | 1.57 |
| 12729 | Cuddebackville | 1285.00 | 27.00 | 2.10 |
| 12746 | Hugenot | 1560.00 | 0.00 | 0.00 |
| 12771 | Port Jervis | 13475.00 | 155.00 | 1.15 |
| .05 p = 0.349 | 0.13 |