Correlations of Finance with AIDS Rate

AIDS Rate vs Per Capita Income:
In this scatterplot the expected negative correlation exists where an increased income correlates with a low AIDS rate. Indicated with the  , 20854 has one of the highest Per Capita Incomes and a lower AIDS rates. This high income allows for better healthcare and cleaner, safer living environments with good education systems where AIDS prevention may be taught.
, 20854 has one of the highest Per Capita Incomes and a lower AIDS rates. This high income allows for better healthcare and cleaner, safer living environments with good education systems where AIDS prevention may be taught.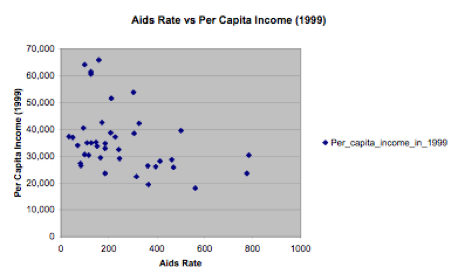

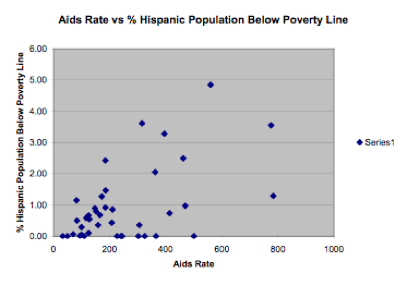
AIDS Rate vs % Population Below Poverty Line:
These two plots demonstrate the positive correlation for the % of Black Population living below the poverty line (left) and the % of Hispanic or Latino Population living below the poverty line. There do again appear to be several outliers, however once these are removed from the calculated correlation a positive correlation remains.
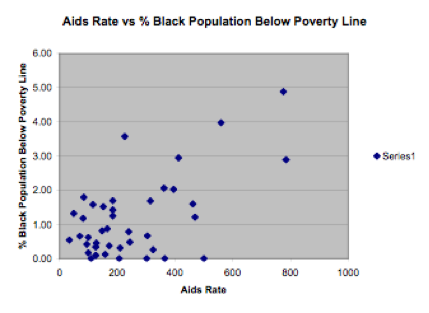
The  reveals that Potomac has a very low percentage of Blacks and Hispanics or Latinos below the poverty line with AIDS. The several outlying points in the graph exhibit there are areas around the county where this same situation does not hold constant, and efforts need to be made in lowering not only the AIDS rate but also the percentage of the race below the poverty line.
reveals that Potomac has a very low percentage of Blacks and Hispanics or Latinos below the poverty line with AIDS. The several outlying points in the graph exhibit there are areas around the county where this same situation does not hold constant, and efforts need to be made in lowering not only the AIDS rate but also the percentage of the race below the poverty line.