| Home |
| Governmental Income |
| Income |
| Poverty |
| Race |
| Crime |
| Male Partners |
| Maps |
| Graphs |
| Data Tables |
| Works Cited |
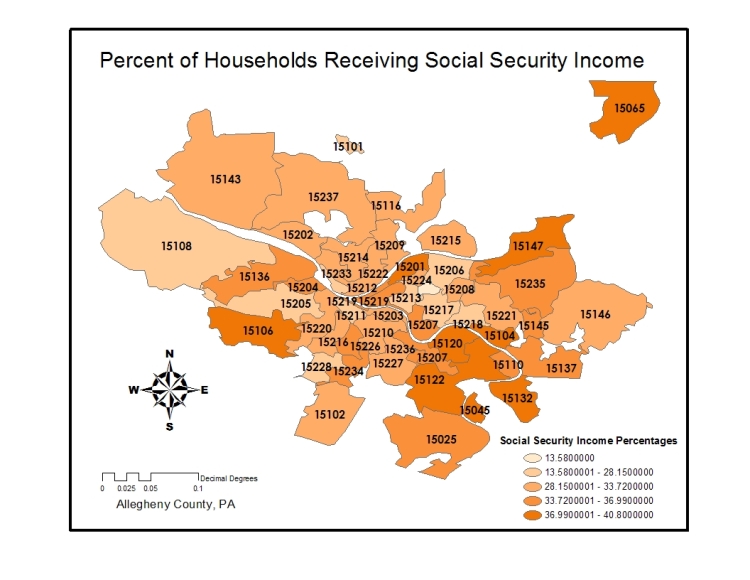
When thinking about what correlations would work, it seemed as if social security income would produce a strong predicted association. Under the assumption that cumulative AIDS rates are more common in poor areas – as enhanced by the elevated AIDS rates in East Liberty – it seemed likely that poor areas would be receive social security income as a form of welfare. However, this correlation was not quite as strong as one would think, marking only within the 95% confidence interval. Indeed, this proves a significant correlation; however, it was one produced at a lower confidence interval than many others that well surpassed the 99% interval. In fact, the social security income patterns, when correlated with cumulative AIDS rates, provided a coefficient of only -0.34, passing the 95% significance level of 0.279, but not nearly reaching the significance level of 0.451 necessary for a 99% significance ranking (Tables 1.1, 1.4; Graph 1.3; Maps 1.1, 1.14).
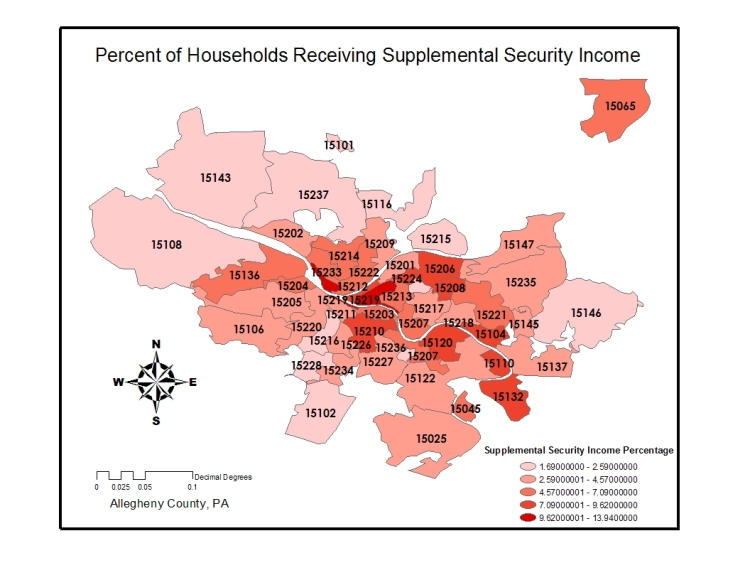
In defining social security as “the comprehensive federal program of benefits providing workers and their dependents with retirement income, disability income, and other payments,” it became apparent that welfare - which seemed synonymous with social security at first - was actually hidden under the titles of public assistance and supplemental security income (Social Security, 1). When the percent of the zip code population on supplemental security income was correlated with cumulative AIDS rates, the level received was .61, suggesting that assisted welfare, or in particular, assistance for those “…who have limited income and resources,” was indeed associated with AIDS rates in Allegheny County (World Institute on Disability) (Tables 1.1, 1.6; Graph 1.5; Maps 1.1, 1.11).
 |
|
http://www.publicagenda.org/issues/images/welfare/poverty_foodstamps.jpg |
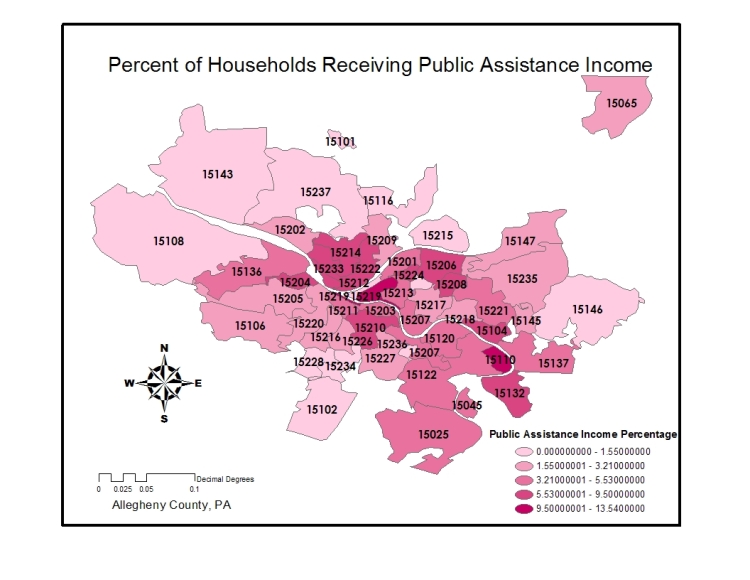
Furthermore, when correlating the percent of the community on public assistance income with cumulative AIDS rates, the coefficient produced was 0.44 (Table 1.1, 1.5; Graph 1.4; Maps 1.1, 1.7). This level is notable since it falls within the 95% interval, but even more enthralling is the fact that this coefficient lies a mere .1 below the significance level of 0.451 needed for the 99% interval. Now if we remove the outlier of zip code 15110, which had a public assistance percentage of 13.54 and a cumulative AIDS rate of 190.94, we can see that the correlation coefficient between percentage on public assistance and cumulative AIDS rates jump up to 0.51, a number well over the required significance level (Table 1.1, 1.14; Graph 1.15). This area of 15110 is within the Duquesne community, a fairly urban area with elevated poverty, which may help to explain why it is such a large outlier within the public assistance correlation. Public assistance is viewed as a collaboration of multiple programs including: Temporary Assistance for Needy Families (TANF), which “provides temporary financial assistance to needy families,” child care assistance, food stamps, and general welfare programs (Public Assistance Programs). Its relationship with AIDS could have easily stemmed from an income or poverty issue within certain zip codes in the Pittsburgh region.