Race and Ethnicity
Median Income and Median Family Income
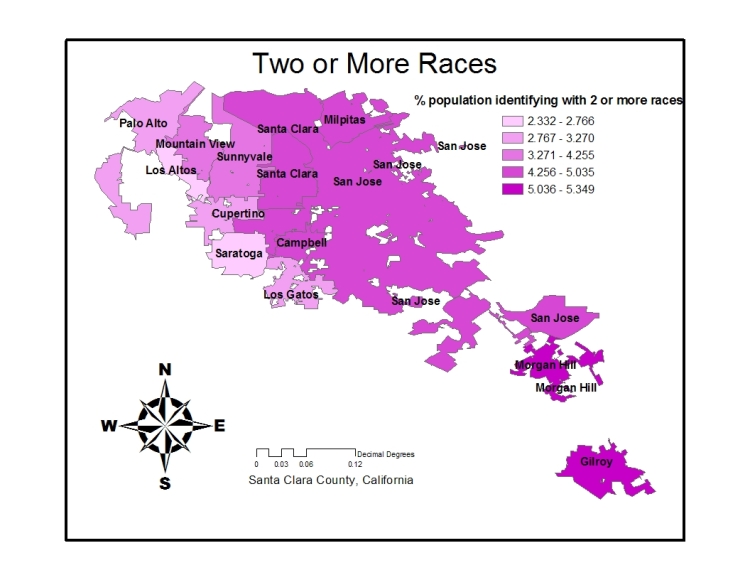
Only one of the race and ethnicity populations correlated significantly with the cumulative AIDS rate, and that was the percent of the population that identifies with two or more races. The graph of the percent two or more races and the map of the frequency can be seen below. The data can be found in Table 6.
None of the other six correlations I attempted between race/ethnicity
and AIDS rate actually correlated significantly. A huge shift in
percentages of people of different races and ethnicities probably
accounts for that. For example, in the 2000 census, Santa Clara County
was, on average, 54% white. However, back in the 1980s, before a huge
number of immigrants came to work in the high-tech industries, Santa
Clara County was closer to 80% white (www.bayareacensus.ca.gov).
In 1980, Santa Clara County was 3.3% black or African American, and in
2000, it was only 2.8%. In 1980, SCC was 17.4% Hispanic or Latino/a, but
in 2000 the percentage had jumped to 24.
There is also a
disparity in the wealth and status of immigrants coming from different
areas of the world, so there is no general correlation between
foreign-born people and AIDS rate or native-born people and AIDS rate,
or even country of birth and AIDS rate. The graphs for the
six races and ethnicities that did not correlate significantly with AIDS
rates, and also the graphs for foreign and native born people can be seen
below. The data can be found in Table 7.