
Median Income and Median Family Income
The AIDS rates for Santa Clara County are taken from cumulative data from 1983 to 2005. However, back in 1983, Santa Clara County was a very different place than it is now, and today it is even different than it was in the 1990s. With the rise of the internet in the 1990s came the golden age of Silicon Valley. People came from all over the world for the opportunity to take part in the internet bubble. Therefore, it is an ever-changing area of the United States. This may be one of the main reasons why much of the data did not correlate with the AIDS rates – any one of the cities in Santa Clara County is very different now than it was back in the 1980s or 90s. For that reason, many of the correlations would not make sense now.
Thirteen out of fifteen cities in Santa Clara County had available AIDS data. Therefore, in order for a correlation between certain demographic values and the cumulative AIDS rate to be statistically significant at the 95% confidence level (that is, there is a relationship between the two variables), the correlation coefficient, r, needed to be above +/-0.553. Some calculated values were slightly less than 0.553, and they were statistically significant at the 90% confidence level. For that significance, r needed to be above 0.476.
Below are the maps for the incidences of AIDS and the population distributions of Santa Clara County.
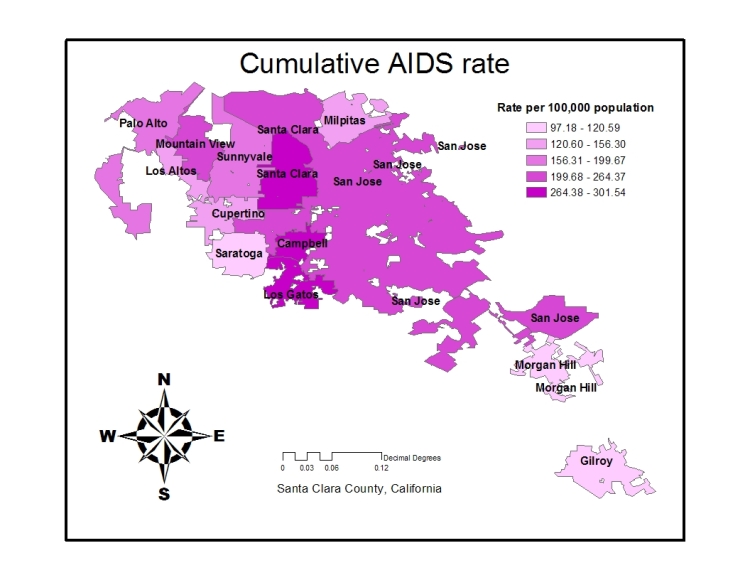
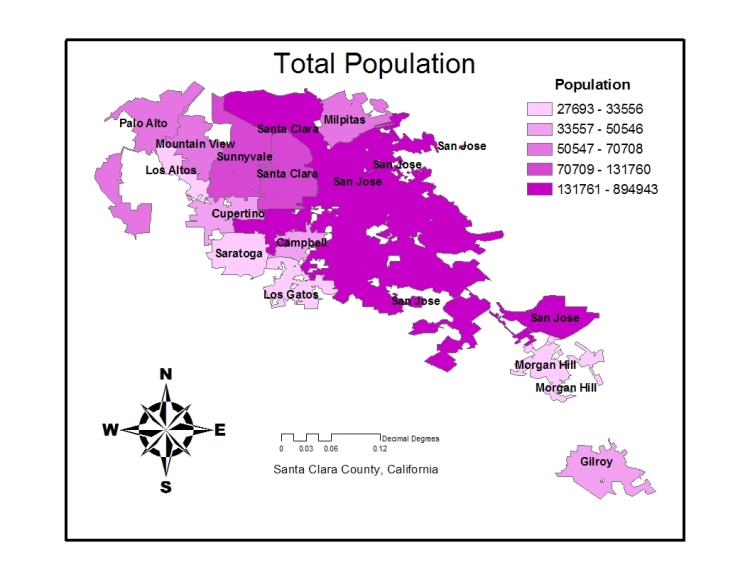
The data for AIDS rates and population can be found in Table 1.