Median Income and Median Family Income
Crime Rate
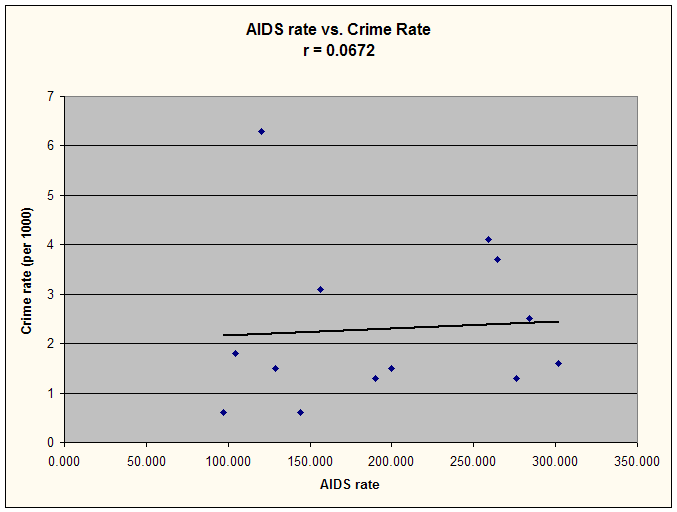
The data for violent crime rates for cities in Santa Clara County were obtained from ePodunk a site with information about cities, counties, and states in the US. A violent crime is defined as one that falls into one of four categories: assault, robbery, rape, or homicide (Violent Crime). The correlation for violent crime was, surprisingly, not significant, with an r value of 0.067. Once again, Gilroy was an outlier, with the highest violent crime rate in Santa Clara County. That is unexpected, because Gilroy also has a low cumulative AIDS rate. Usually, violent crime is associated with an HIV/AIDS prevalence. Once again, there must be something different about Gilroy in terms of demographics that causes it to have a lower AIDS rate, yet the lowest median income and highest violent crime rate. Gilroy does have a relatively low MM UPH percentage, but it is not the lowest in the county. However, once Gilroy was removed, the violent crime rate correlated with an r value of just .447, which is not significant. These data can possibly be explained by the fact that, as stated before, the majority of AIDS cases in Santa Clara County come from MSM, and not from intravenous drug use, which is more likely to have a correlation with violent crime than homosexuality. The graph for AIDS rate versus crime rate can be found below. Data on crime rates can be found in Table 10.
