TXI Cement Plant, Midlothian, Texas
Dallas / Fort Worth Metropolitan Area
 
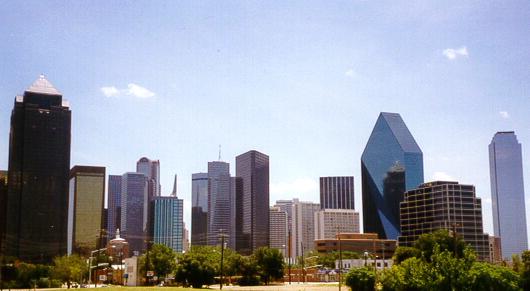
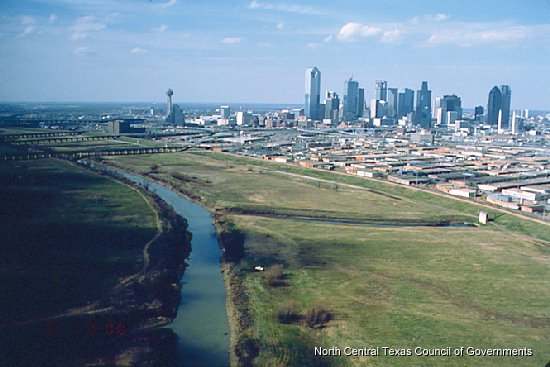
Although not overly dramatic, the wind pattern and weather can have a
significany imact on visibility in downtown Dallas.
On the left, a pristine day. On the right, a more polluted day
with decreased visibilty and haze.

Finally, there are clear environmental links to the urban life of
Dallas.
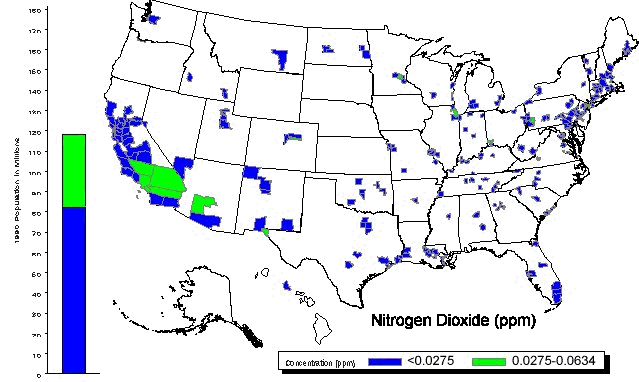
The graph and information below describe the severity of nitrogen oxide pollution in
the Dallas Fort Worth region (the four blue counties in North Central Texas). The
plants listed are the predominant air polluters in the area and their emissions are also
described.

 |
NET Ranking Report |
| EPA Office of Air
Quality Planning And Standards |
April 10, 2000 11 Rows
See Disclaimer |
 |
 |
United States NET Air Pollution Sources
Counties Selected: Ellis
| |
Pollutant Emissions |
Percent of Total Emissions |
| Row # |
CO |
NOX |
PM10 |
SO2 |
VOC |
CO |
NOX |
PM10 |
SO2 |
VOC |
Facility Name |
State |
County |
Year |
Industry Type
(SIC) |
Facility ID |
Region |
| SORT |
  |
  |
  |
  |
  |
  |
  |
  |
  |
  |
  |
  |
  |
  |
  |
  |
  |
| 1 |
3,091 |
1,975 |
306 |
5,864 |
52 |
51.04 |
16.72 |
15.24 |
40.63 |
6.40 |
Holnam Texas, Limited Partnership |
TX |
Ellis Co |
1996 |
3241 - Cement, Hydraulic |
0022 |
06 |
| 2 |
1,736 |
601 |
114 |
144 |
357 |
28.66 |
5.09 |
5.66 |
1.00 |
43.96 |
Chaparral Steel Midlothian, L.P. |
TX |
Ellis Co |
1996 |
3312 - Blast Furnaces And Steel Mills |
0018 |
06 |
| 3 |
844 |
5,506 |
272 |
5,109 |
55 |
13.93 |
46.63 |
13.56 |
35.40 |
6.77 |
Txi. Operations Limited Partnership |
TX |
Ellis Co |
1996 |
3241 - Cement, Hydraulic |
0009 |
06 |
| 4 |
327 |
2,550 |
830 |
3,134 |
34 |
5.39 |
21.59 |
41.29 |
21.71 |
4.19 |
North Texas Cement Company |
TX |
Ellis Co |
1996 |
3241 - Cement, Hydraulic |
0002 |
06 |
| 5 |
23 |
665 |
399 |
0 |
43 |
0.38 |
5.64 |
19.88 |
0.00 |
5.34 |
Owens-Corning |
TX |
Ellis Co |
1996 |
3296 - Mineral Wool |
0005 |
06 |
| 6 |
19 |
158 |
15 |
0 |
9 |
0.32 |
1.34 |
0.75 |
0.00 |
1.12 |
Lone Star Pipeline Company |
TX |
Ellis Co |
1996 |
4922 - Natural Gas Transmission |
0056 |
06 |
| 7 |
11 |
330 |
71 |
181 |
11 |
0.18 |
2.79 |
3.52 |
1.25 |
1.31 |
Ball-Foster Glass Container Company |
TX |
Ellis Co |
1996 |
3221 - Glass Containers |
0003 |
06 |
| 8 |
6 |
24 |
2 |
0 |
211 |
0.10 |
0.21 |
0.10 |
0.00 |
25.96 |
Dart Container Corporation |
TX |
Ellis Co |
1996 |
3089 - Plastics Products, Nec |
0040 |
06 |
| 9 |
0 |
0 |
0 |
0 |
3 |
0.00 |
0.00 |
0.00 |
0.00 |
0.32 |
Martech Incorporated |
TX |
Ellis Co |
1996 |
3299 - Nonmetallic Mineral Products |
0039 |
06 |
| 10 |
0 |
0 |
0 |
0 |
0 |
0.00 |
0.00 |
0.00 |
0.00 |
0.00 |
|
TX |
Ellis Co |
1996 |
1221 - Bituminous Coal & Lignite - Surface |
FUEL |
06 |
| 11 |
0 |
0 |
0 |
0 |
38 |
0.00 |
0.00 |
0.01 |
0.00 |
4.63 |
Koral Industries Incorporated |
TX |
Ellis Co |
1996 |
3089 - Plastics Products, Nec |
0037 |
06 |
| Grand Total |
6,057 |
11,809 |
2,010 |
14,432 |
812 |
Disclaimer:
The NET reports in AIRSData are produced from an extract of EPA's National Emission
Trends (NET) database. Data for this report was extracted from the October 1999 version of
the NET database. The NET is an emissions database developed by EPA for its internal use.
The NET is based partially on emission data obtained from State and local agencies, but it
is not a database of official State emissions data. Please contact the appropriate State
agency to obtain information on a State's official emission inventory. Please contact the EPA to report errors.
Readers are cautioned not to infer a qualitative ranking order of geographic areas based
on AIRSData reports. Air pollution levels measured in the vicinity of a particular
monitoring site may not be representative of the prevailing air quality of a county or
urban area. Pollutants emitted from a particular source may have little impact on the
immediate geographic area, and the amount of pollutants emitted does not indicate whether
the source is complying with applicable regulations. |
|