| AIDSNew Hampshire | |||||
| Perceptions | Analysis | Assessment |
Data |
Sources |
|
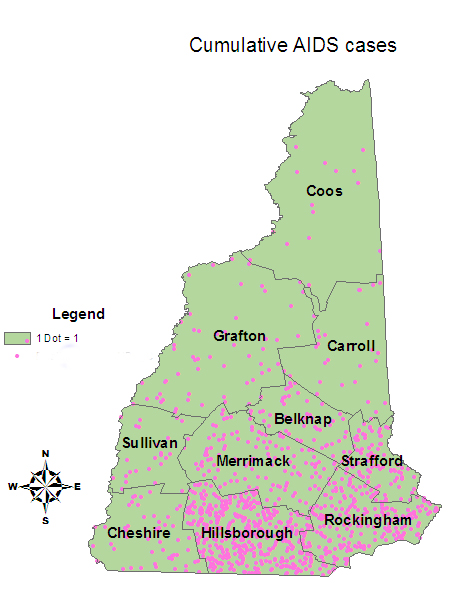
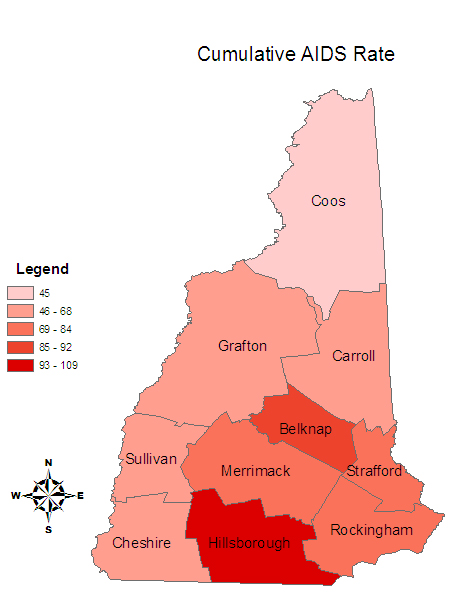
![]()
The population of New Hampshire isn’t distributed evenly. The bottom third of the Granite State is home to 87% of the state’s total population. The counties of Hillsborough and Merrimack alone account for 42% of the total population. The northern third of the state is home to less that 5% of the total population and it is declining in population. The bottom third of the state is home to 87% of the total population. 42% of the population is located in the counties of Hillsborough and Merrimack. 73% of the population is located in the counties of Hillsborough, Rockingham, Merrimack, and Strafford. Concord, the state capital, is located in Merrimack County. The two largest cities, Manchester and Nashua, are both located in Hillsborough County.
New Hampshire has a total of ten counties (n=10). In calculating the correlation coefficient, degrees of freedom (df) was 8. In order for calculations to be significant at the 95% confidence interval, I needed a correlation coefficient of +/-0.632 or higher.
| Correlation Coefficient | P-Value | Level of Confidence | |
| Average travel time to nearest gay bar | -0.894 | 0.010 | 99.0% |
| Agriculture, forestry, fishing and hunting rate per 100,000 | -0.880 | 0.010 | 99.0% |
| Median gross rent | 0.814 | 0.010 | 99.0% |
| Percent black | 0.808 | 0.010 | 99.0% |
| Median family income in 1999 | 0.780 | 0.010 | 99.0% |
| Less than high school rate | -0.762 | 0.025 | 97.5% |
| 2000 poverty rate | -0.758 | 0.025 | 97.5% |
| Per capita income in 1999 | 0.741 | 0.025 | 97.5% |
| Percent white | -0.737 | 0.025 | 97.5% |
| Population density | 0.727 | 0.025 | 99.0% |
| Percent urban | 0.712 | 0.025 | 97.5% |
| Incomplete plumbing facility rate | -0.679 | 0.050 | 95.0% |