Home Correlation Analysis äIntroduction äPoverty Status and Households äLanguage äEducation äRace äOutliers äTransportation, Plumbing and Syphilis äConclusion Detailed Tables Maps Maps 1 Maps 2 Maps 3
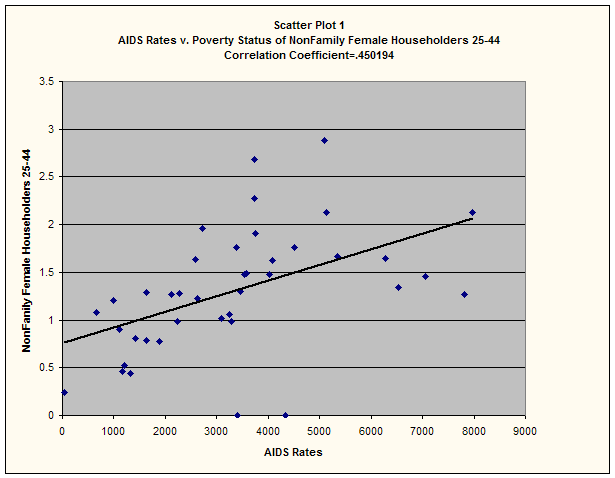
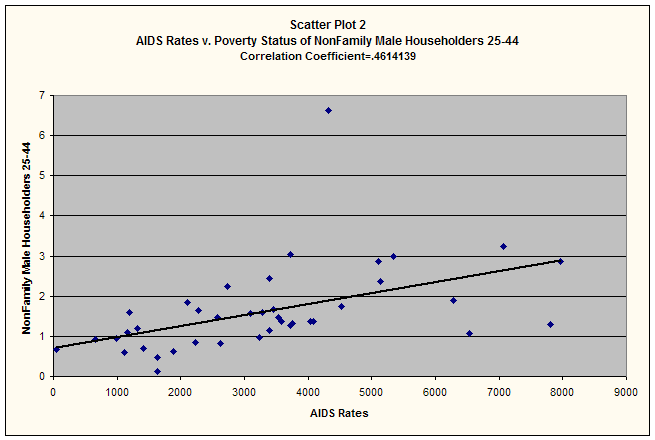
A correlation analysis of the cumulative AIDS rate and the poverty rate revealed a positive correlation. It was shown that males and females of NonFamily households between ages 25 and 44 had higher infection rates of AIDS as their percent out of the total number of NonFamily householders increased. The correlation coefficients were x=.46 and x=.45 respectively (Refer to scatter plots 1&2)
It was not unexpected that this data correlated because evidence reported in news sources such as the Primetime Live program, Out of Control: AIDS in Black and White reiterated the fact that AIDS occurs more commonly between ages 25 and 44. Other factors that correlated were the percent of NonFamily households and NonFamily male householders (Refer to scatter plots 3&4).
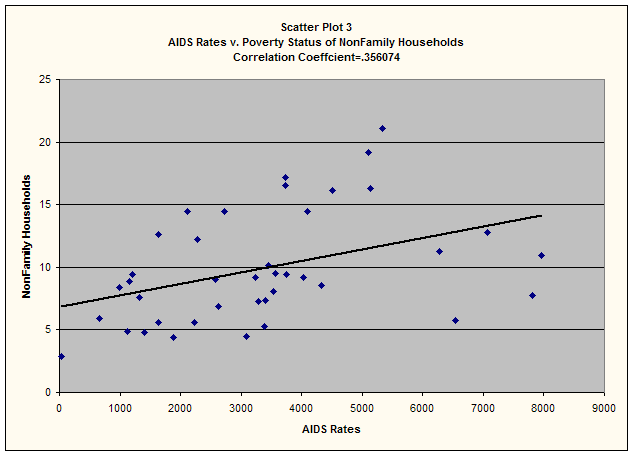
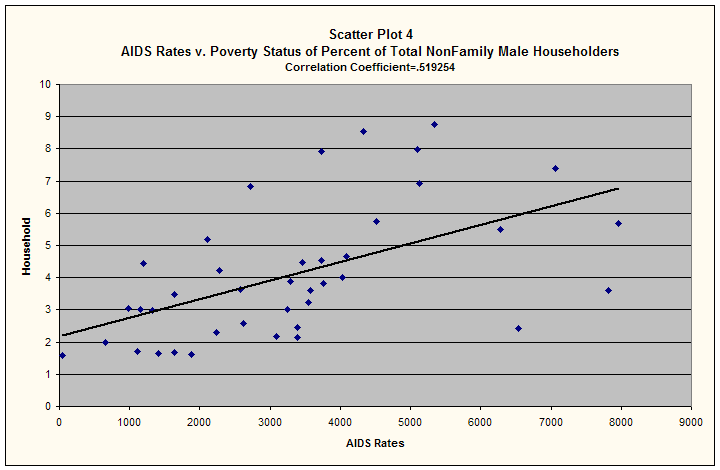
The correlation could be caused in part by people living in poverty not having access to many resources. Such as health care, education, and social services. The number of NonFamily male householders is larger than the number of NonFamily female householders and that is factored into the percent of NonFamily households. Unmarried individuals correlated with the AIDS rates as well as families with no related children (Refer to scatter plots 5&6).
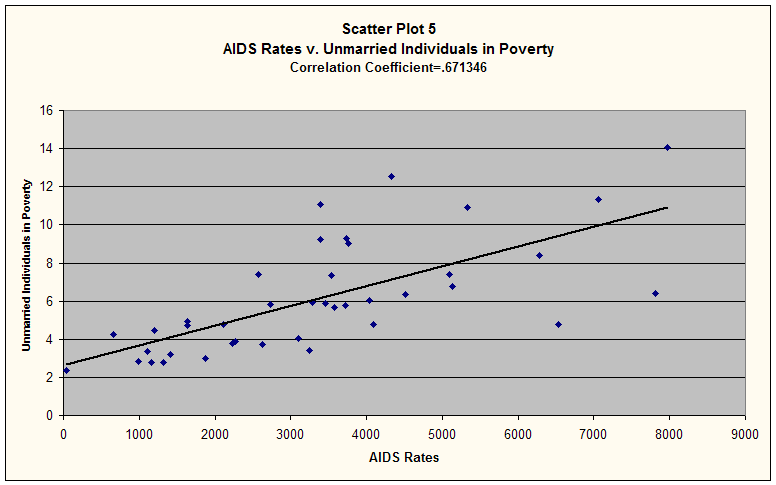
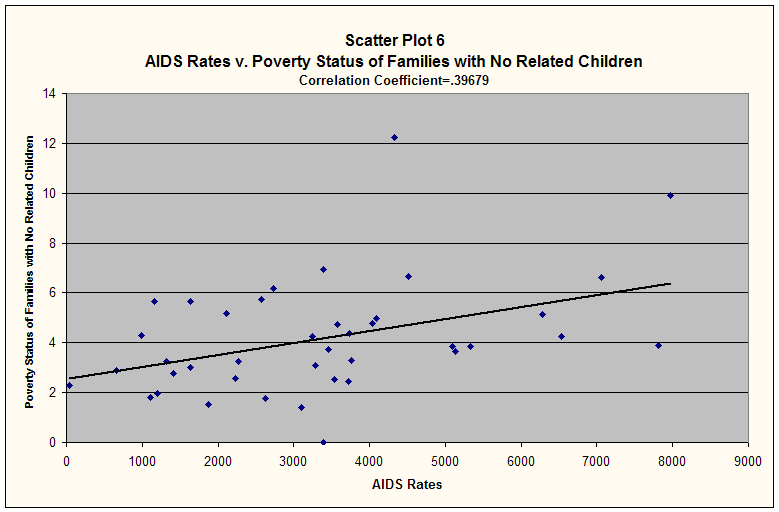
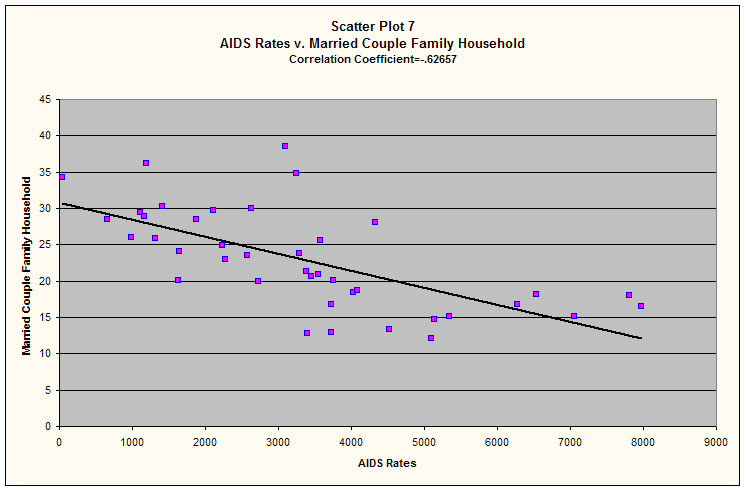
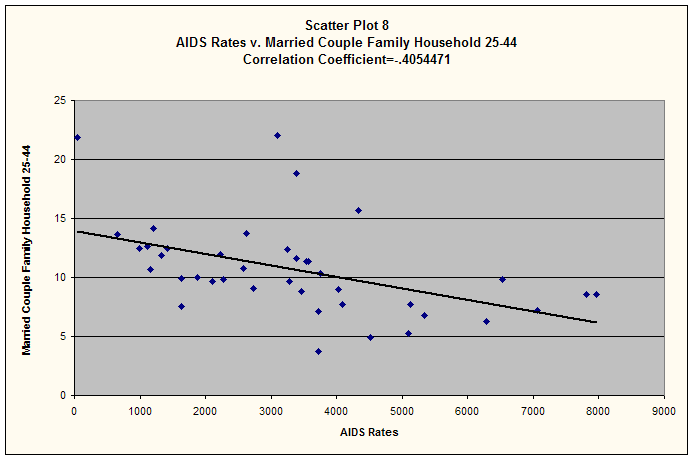
Families in poverty with no related children could possibly be foster homes with children infected with AIDS. Unmarried individuals are prone to having a higher number of sexual partners which increases their chance of contracting HIV. This is suggested because there is a negative AIDS rates correlation of .63 with the percent of married couple households in poverty and married couple householders between 25 and 44 (Refer to scatter plots 7&8).
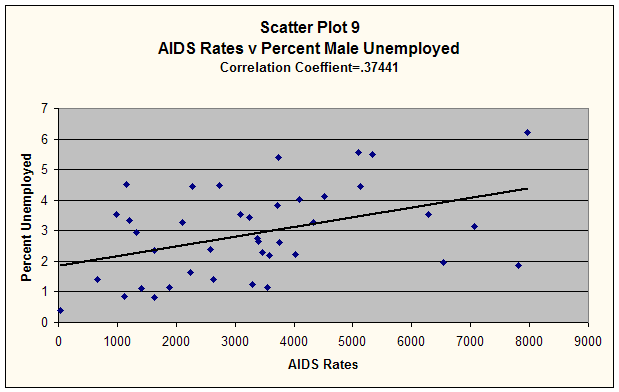
A correlation also appeared among the percent of males that were unemployed which also suggests that the cumulative AIDS rate is tied to economics (Refer to scatter plot 9).