
The Cold Hard Facts About AIDS in Connecticut
|
A Look Into Correlations Between Race and AIDS Rate See Maps 2 & 3 |
|||||||||
|
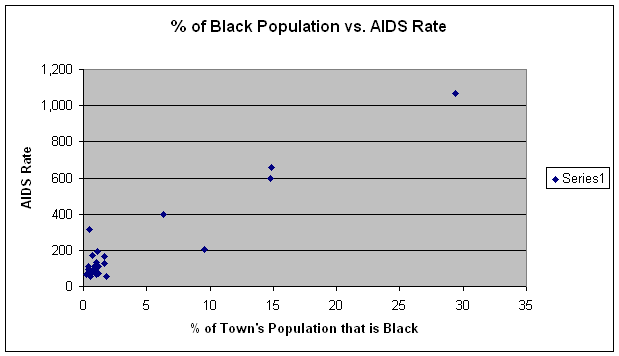
Following the completion of my first paper, and my investigation into the populations most affected by the AIDS virus, I came to the conclusion that race was often a fairly accurate indicator of infection in Fairfield County. I, therefore, calculated the correlation between AIDS rate and the percentages of White, African American, and Hispanic persons in a given town.
|
By using the information supplied by the Census 2000, I found that the AIDS rate and the percentage of the population that was black correlated at a rate of 0.950, much larger than the p-value of 0.413 required in determining significance. A rate of 0.950 indicates that the reader can be sure that, 99% of the time, an increase in the number of African Americans in a community would increase the number of AIDS cases in that community.

|
||||||||
|
A similar situation arose once I computed the correlation between Hispanics and the AIDS rate and arrived at the correlation coefficient of 0.954, ensuring an increase in AIDS cases with an increase in Hispanics 99% of the time. |
However, after calculating the correlation between the percentage of whites in a town and the AIDS rates, I realized that while the two variables were just as highly correlated as the aforementioned correlations between AIDS rates and race, the correlation was negative, indicating that the more white persons present in a town, the less likely it is that that town will suffer from a large AIDS rate.
|
||||||||