 Home
Page
Home
Page
Hispanics, The "Umbrella Term"
Hispanics, The "Umbrella Term"
Barriers to Prevention Program
Hispanics, The “Umbrella” Term
The term Hispanic is used to identify a number of different races. The U.S census Bureau in particular, uses the term “Hispanic” to identify over 20 races (Table 2). This lack of specification is misleading because infection rates can misrepresent certain Hispanic sub-groups. Furthermore, when it comes to concepts such as stigma and modes of transmission, one explanation is not representative of the whole. For example, Puerto Ricans in the United States contract HIV largely through injection drug use (2). However, other Latino groups, such as Cubans and Mexicans, contract HIV mainly through MSM. Therefore, when assembling a plan to combat the growing AIDS epidemic in the Hispanic community of Onondaga County, the differences in culture and race are crucial. Furthermore, this strongly suggests a deeper look into what type of Hispanic makes up the majority of Onondaga County and therefore the majority of HIV/AIDS cases.
(B)

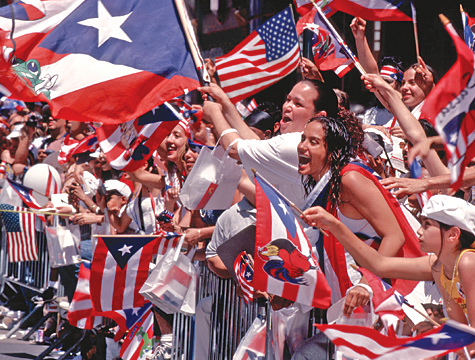
The Puerto Rican Majority
According to the U.S Census Bureau, as of the year 2000, the Hispanic population in Onondaga County is 11175 or 2.4% (Table 2) (Figure 1). Broken down even further, the Hispanic sub-group with the highest concentration in Onondaga County is the Puerto Ricans. With a population of 6098, Puerto Ricans make up 55% of the Hispanic Population in Onondaga County. The smallest evident Hispanic sub-group is the Uruguayans whose population includes 2. In comparison to the Puerto Ricans, the Uruguayans make up .02% of the Hispanic population (Table 2). This drastic difference is what makes the term “Hispanic” too broad when dealing with the AIDS epidemic.
Because the Puerto Ricans make up the majority of the Hispanic population in Onondaga County, the issue lies in their community. Therefore, finding the area in Onondaga County with the highest concentration of Puerto Ricans is vital. It turns out that the zip code 13204 (Syracuse) holds the highest concentration of Puerto Ricans (Table 3). As a result, 13204 becomes the area that deserves the most attention.
(C)
Modes of Transmissions within the Puerto Rican Community
Puerto Ricans in the United States contract HIV mainly through injection drug use (IDU). Therefore, when formulating a plan, a large component of the work will have to deal with IDU. Even when compared to other racial/ethnic groups, Puerto Ricans use injected drugs more frequently than Mexican Americans and African Americans (3).
It is also evident that Latino’s in the United States in comparison to Whites and African Americans become sexually active at a younger age (4).To further accentuate that point, Latinos are less likely to use condoms. The results are exemplified through the higher rate of pregnancy in the Hispanic community. Though these statistics may not be an accurate representation of a particular race/ethnic group, there is no denying that Puerto Ricans make up the majority of Onondaga’s Hispanic community and therefore a major contributor to these statistics. However, there are common difficulties when reaching out to the Hispanic community.
Table 2: U.S Census Bureau, Hispanic Origin, 2000
|
Total population: Total |
Total population: Not Hispanic or Latino |
Total population: Hispanic or Latino |
Total population: Hispanic or Latino; Mexican |
Total population: Hispanic or Latino; Puerto Rican |
Total population: Hispanic or Latino; Cuban |
Total population: Hispanic or Latino; Dominican Republic |
|||
|
458336 |
447161 |
11175 |
1331 |
6098 |
742 |
333 |
|||
|
Total population: Hispanic or Latino; Central American |
Total population: Hispanic or Latino; Central American; Costa Rican |
Total population: Hispanic or Latino; Central American; Guatemalan |
Total population: Hispanic or Latino; Central American; Honduran |
Total population: Hispanic or Latino; Central American; Nicaraguan |
Total population: Hispanic or Latino; Central American; Panamanian |
Total population: Hispanic or Latino; Central American; Salvadoran |
|||
|
310 |
35 |
98 |
36 |
14 |
92 |
29 |
|||
|
Total population: Hispanic or Latino; Central American; Other Central American |
Total population: Hispanic or Latino; South American |
Total population: Hispanic or Latino; South American; Argentinean |
Total population: Hispanic or Latino; South American; Bolivian |
Total population: Hispanic or Latino; South American; Chilean |
Total population: Hispanic or Latino; South American; Colombian |
Total population: Hispanic or Latino; South American; Ecuadorian |
|||
|
6 |
580 |
36 |
11 |
57 |
187 |
97 |
|||
|
Total population: Hispanic or Latino; South American; Paraguayan |
Total population: Hispanic or Latino; South American; Peruvian |
Total population: Hispanic or Latino; South American; Uruguayan |
Total population: Hispanic or Latino; South American; Venezuelan |
Total population: Hispanic or Latino; South American; Other South American |
Total population: Hispanic or Latino; Other Hispanic or Latino |
Total population: Hispanic or Latino; Other Hispanic or Latino; Spaniard |
|||
|
14 |
87 |
2 |
59 |
30 |
1781 |
64 |
|||
|
Total population: Hispanic or Latino; Other Hispanic or Latino; Spanish |
Total population: Hispanic or Latino; Other Hispanic or Latino; Spanish American |
Total population: Hispanic or Latino; Other Hispanic or Latino; All other Hispanic or Latino |
|
||||||
|
397 |
27 |
1293 |
|
||||||
Figure 1: Hispanic Distribution