 Neighborhoods Most Affected
 (12)
(12)
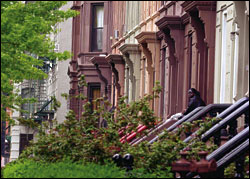
Brooklyn’s rate of infection which is approximately 1,088.02 per 100,000 persons from the years 1981 to 2005 is nearly four times higher than that of the United States which is 339.71 per 100,000 persons from the years 1981 to 2005 (10). Considering the fact that this is the calculation for one borough, this rate is extremely high. It also shows that there is a major problem in Brooklyn. Certain neighborhoods in particular are more affected than others due to the mode of transmission. Less wealthy areas like Bedford-Stuyvesant, Crown Heights, East Flatbush, East New York, Brownsville and Bushwick -11212, 11216, 11233, 11238,11226,11207,11206 and 11221− have higher rates than the other neighborhoods in Brooklyn (9). There are trends that indicate a higher incidence of HIV infection among certain races in these area codes as well. According to data collected from the New York City Department of Health, Brooklyn has a disproportionately high percentage of African Americans affected with the virus in comparison to other races.
Years 1981-2005:
| Zip code | AIDS Cases | Total Population | Rate per 100,000 |
| 11201 | 945 | 47,746 | 1,979.22 |
| 11203 | 876 | 84,498 | 1,036.71 |
| 11204 | 205 | 74,880 | 273.77 |
| 11205 | 765 | 35,662 | 2,147.55 |
| 11206 | 1,454 | 69,032 | 2,106.27 |
| 11207 | 1,139 | 86,551 | 1,315.99 |
| 11208 | 986 | 87,165 | 1,131.19 |
| 11209 | 295 | 69,840 | 422.39 |
| 11210 | 365 | 62,308 | 585.80 |
| 11211 | 868 | 85,089 | 1,020.11 |
| 11212 | 1,560 | 85,161 | 1,831.82 |
| 11213 | 975 | 65,440 | 1,489.91 |
| 11214 | 278 | 83,546 | 332.75 |
| 11215 | 763 | 63,001 | 1,211.09 |
| 11216 | 1,168 | 55,775 | 2,094.13 |
| 11217 | 898 | 35,353 | 2,540.10 |
| 11218 | 392 | 74,611 | 525.39 |
| 11219 | 208 | 85,987 | 241.90 |
| 11220 | 638 | 92,718 | 688.11 |
| 11221 | 1,432 | 76,363 | 1,875.25 |
| 11222 | 286 | 39,360 | 726.63 |
| 11223 | 308 | 77,691 | 396.44 |
| 11224 | 427 | 51,205 | 833.90 |
| 11225 | 797 | 63,774 | 1,249.73 |
| 11226 | 1,479 | 106,154 | 1,393.25 |
| 11228 | 94 | 41,172 | 228.31 |
| 11229 | 182 | 80,554 | 225.93 |
| 11230 | 313 | 88,933 | 351.95 |
| 11231 | 506 | 32,974 | 1,534.54 |
| 11232 | 244 | 27,723 | 880.14 |
| 11233 | 1,118 | 61,955 | 1,804.54 |
| 11234 | 258 | 86,898 | 296.90 |
| 11235 | 301 | 77,451 | 388.63 |
| 11236 | 442 | 96,301 | 458.98 |
| 11237 | 650 | 48,910 | 1,328.97 |
| 11238 | 1,265 | 48,965 | 2,583.48 |
| 11239 | 106 | 14,620 | 725.03 |
Brooklyn vs. United States Graph