|
|
|
|
|
|
|
|
|
Appendix
Table 1. Categorization of Correlations
| Correlation Coefficient | p < | Level of Confidence | |
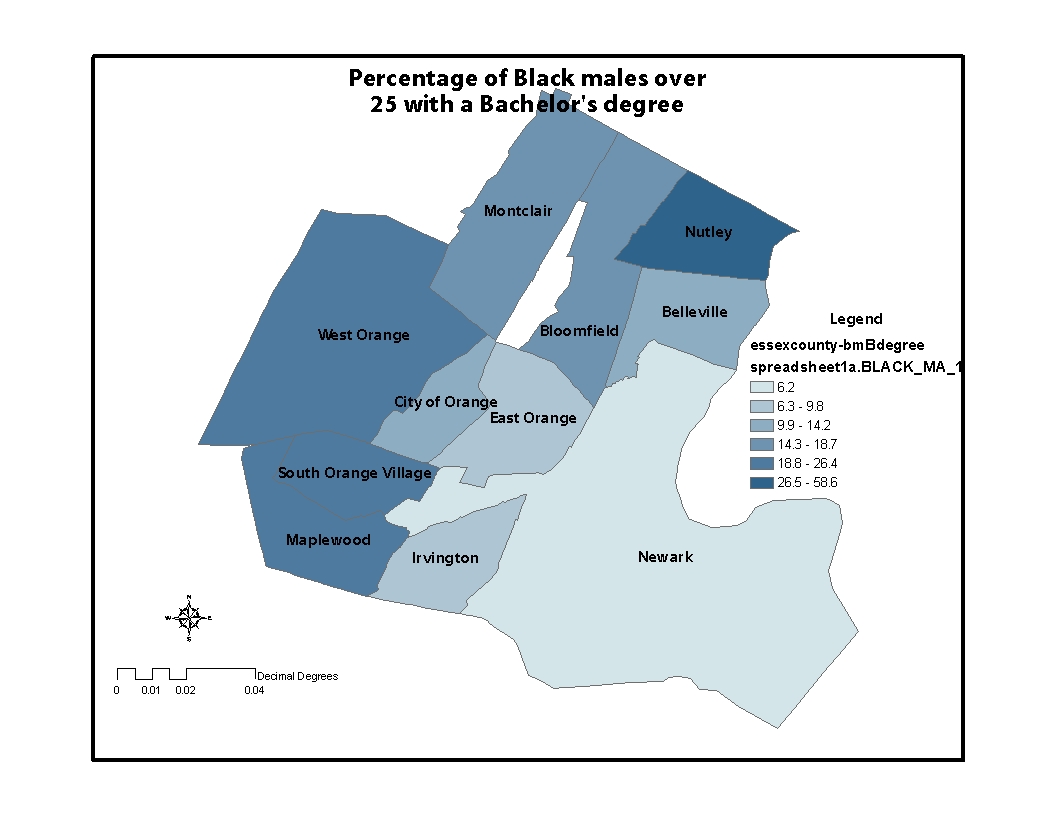
| Percent Black Males with a Bachelor's Degree | -0.610 | 0.05 | 95% |
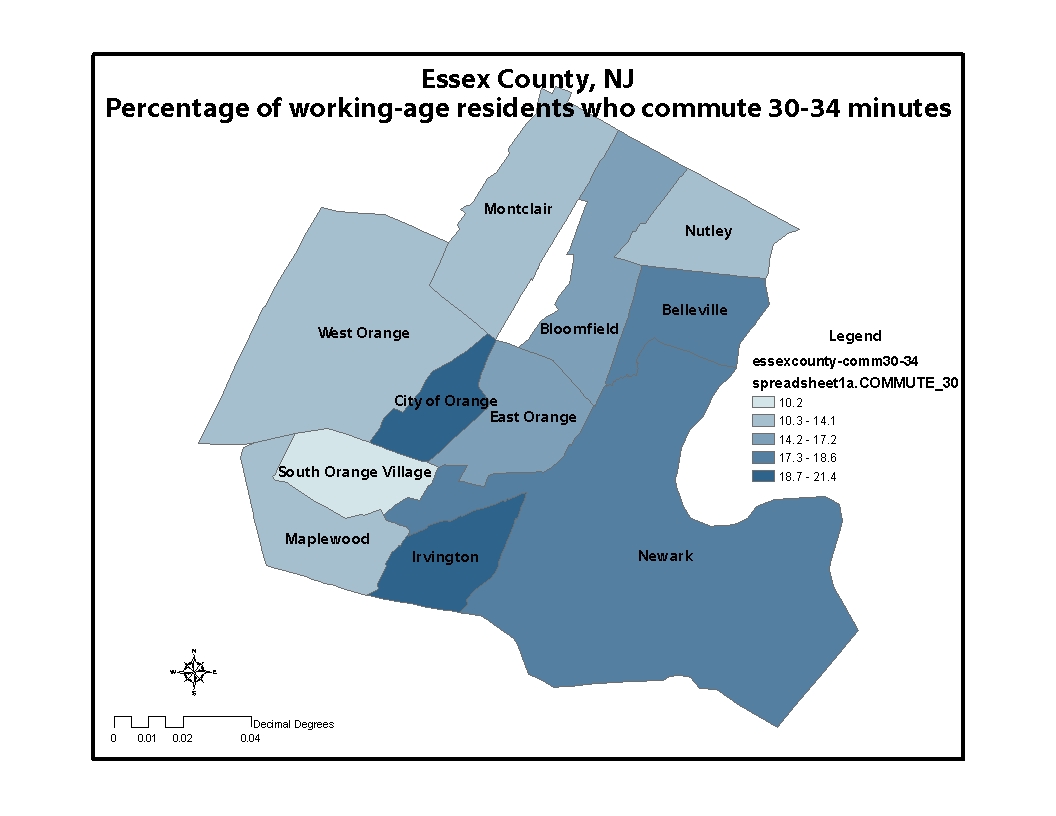
| Commute to Work (30-34 minutes) | 0.622 | 0.05 | 95% |
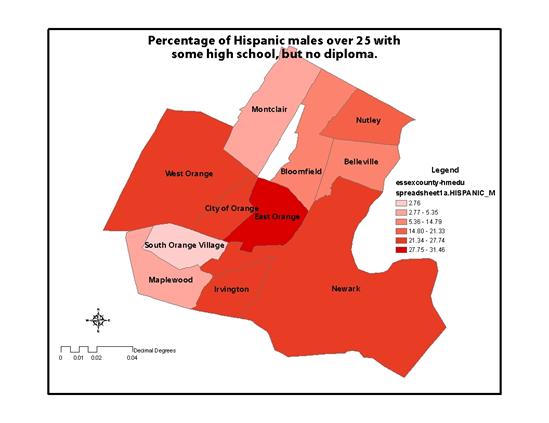
| Percent Hispanic Males with some High School, no diploma | 0.639 | 0.05 | 95% |
| Percent White females with Bachelor's degree | -0.670 | 0.025 | 97.50% |
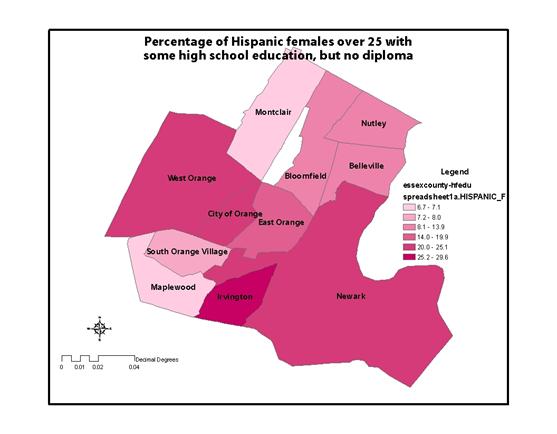
| Percent Hispanic females with some High School, no diploma | 0.679 | 0.025 | 97.50% |
| Percent Black Females with a Bachelor's Degree | -0.701 | 0.025 | 97.50% |
| Percent Asian | -0.718 | 0.025 | 97.50% |
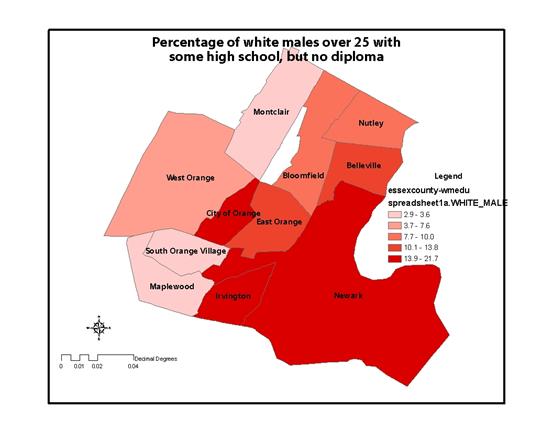
| Percent White males with some High School, no diploma | 0.725 | 0.025 | 97.50% |
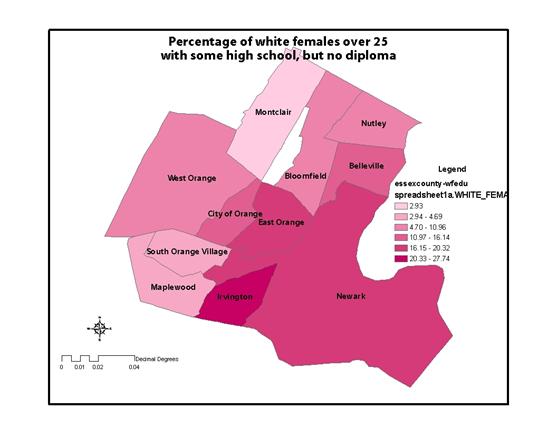
| Percent White females with some High School, no diploma | 0.746 | 0.01 | 99% |
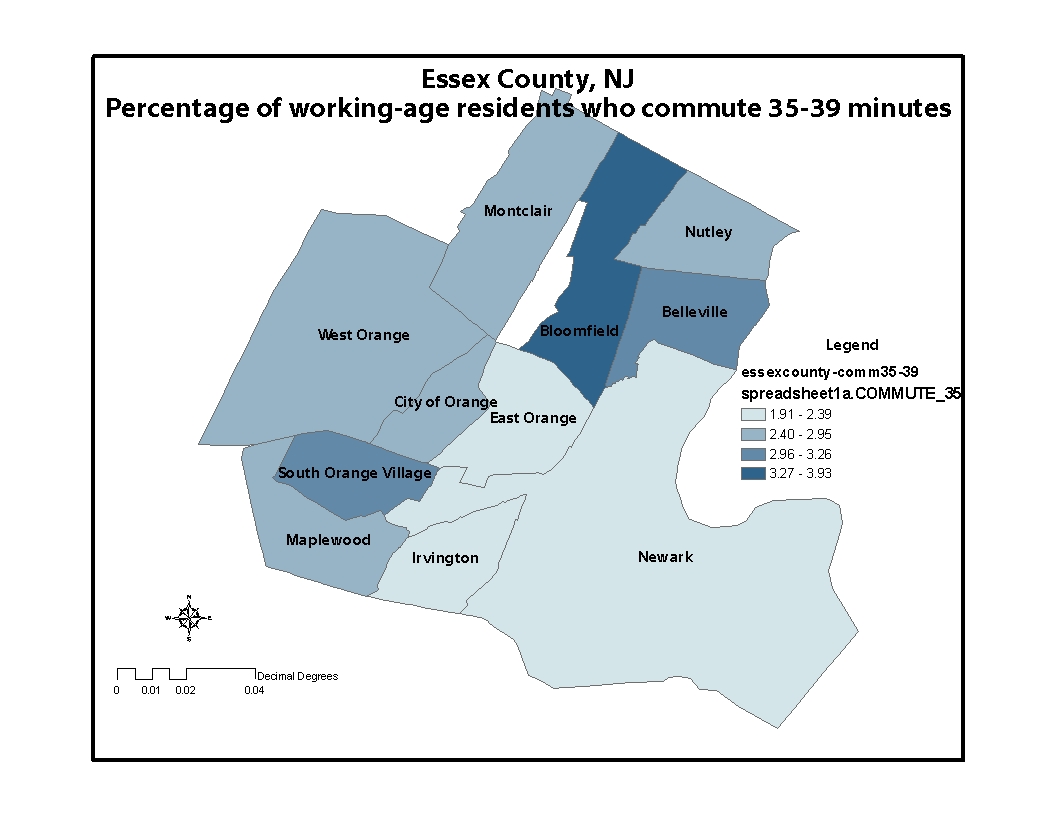
| Commute to Work (35-39 minutes) | -0.760 | 0.01 | 99% |
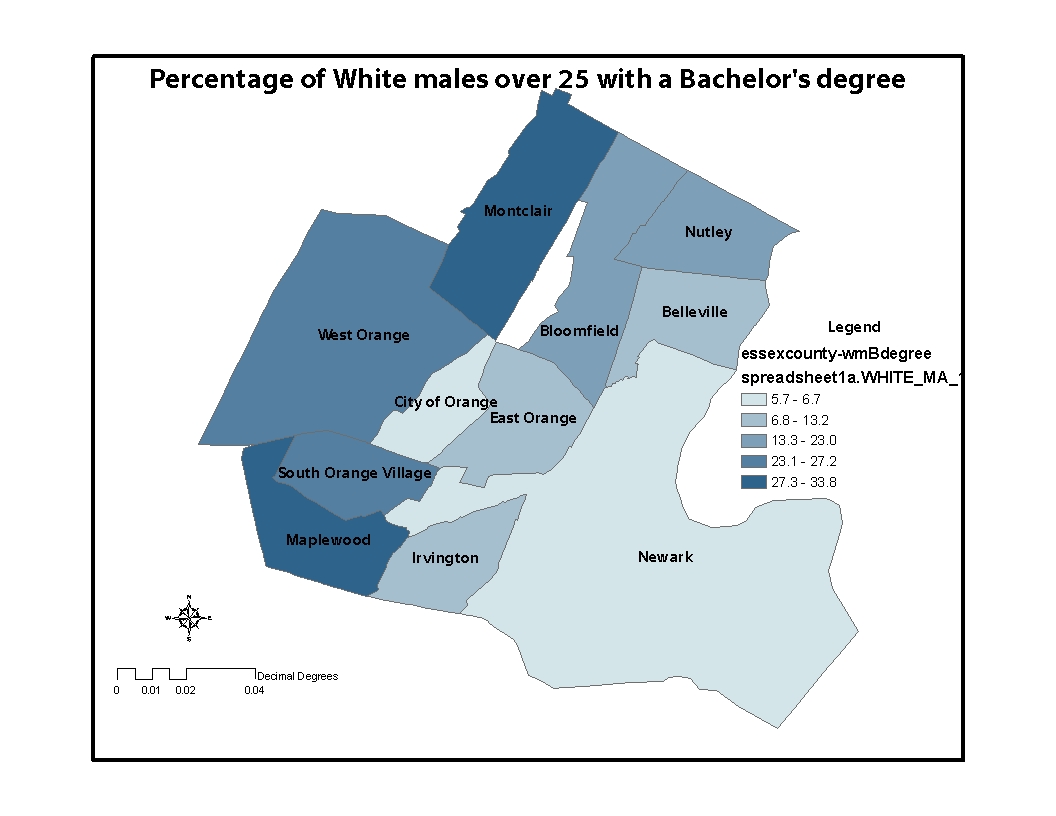
| Percent White males with a Bachelor's Degree | -0.768 | 0.01 | 99% |
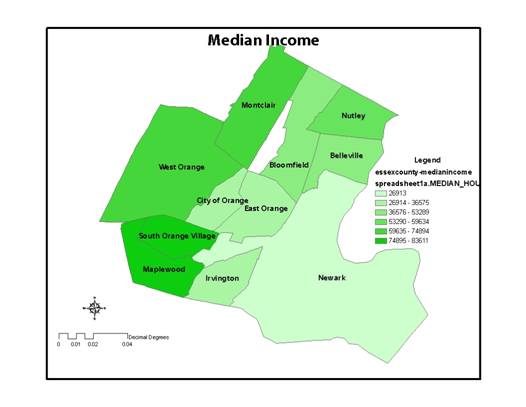
| Median Income | -0.814 | 0.01 | 99% |
| Percent Black | 0.817 | 0.01 | 99% |
| Percent Native American | 0.842 | 0.01 | 99% |
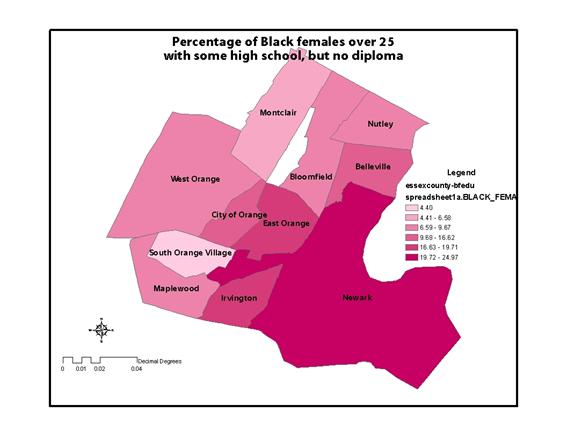
| Percent Black females with some High School, no diploma | 0.886 | 0.01 | 99% |
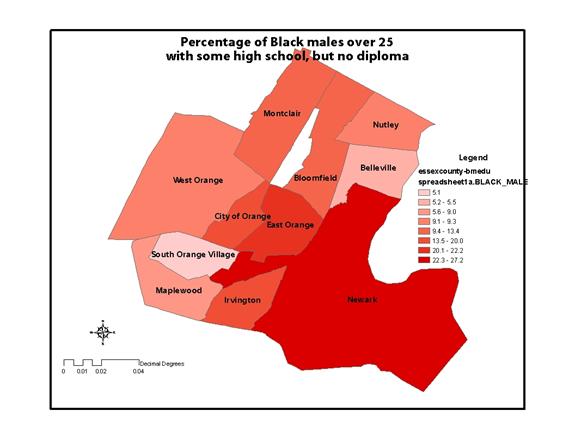
| Percent Black males with some High School, no diploma | 0.934 | 0.01 | 99% |
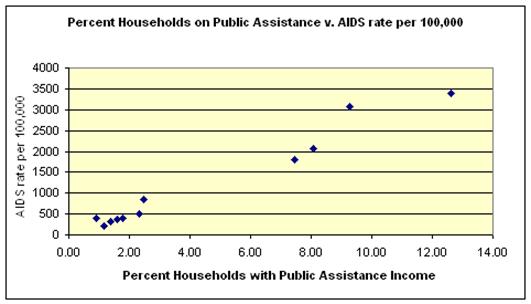
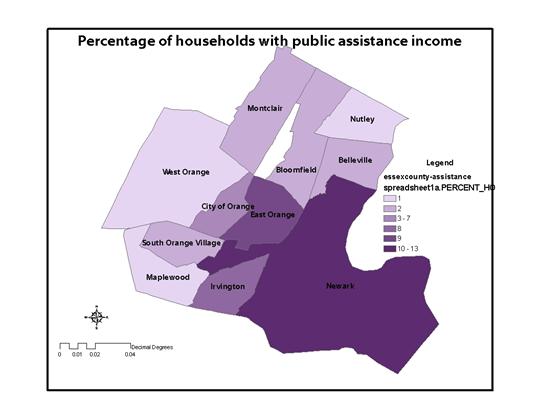
| Percent Households with public assistance income | 0.983 | 0.01 | 99% |
| Figure
1.
|
Figure
2.
 |
| Figure 3.
|
| Figure 4.
|
| Figure 5.
|
| Figure 6.
|
| Figure 7.
|
| Figure 8.
|
| Figure 9.
|
| Figure 10.
|
| Figure 11.
|
| Figure 12.
|
| Figure 13.
|
| Figure 14.
|
| Figure 15.
|
| Figure 16.
|
| Figure 17.
|
| Figure 18.
|
| Figure 19.
|
| Figure 20.
|
| Figure 21.
|
| Figure 22.
|
| Figure 23.
|
| Figure 24.
|
| Figure 25.
|


| Figure 26.
|
| Figure 27.
|
| Figure 28.
|
| Figure 29.
|
| Figure 30.
|
| Figure 31.
|
| Figure 32.
|