CORRELATION ANALYSIS
Manhattan, NY: One Problem, Two Different Groups
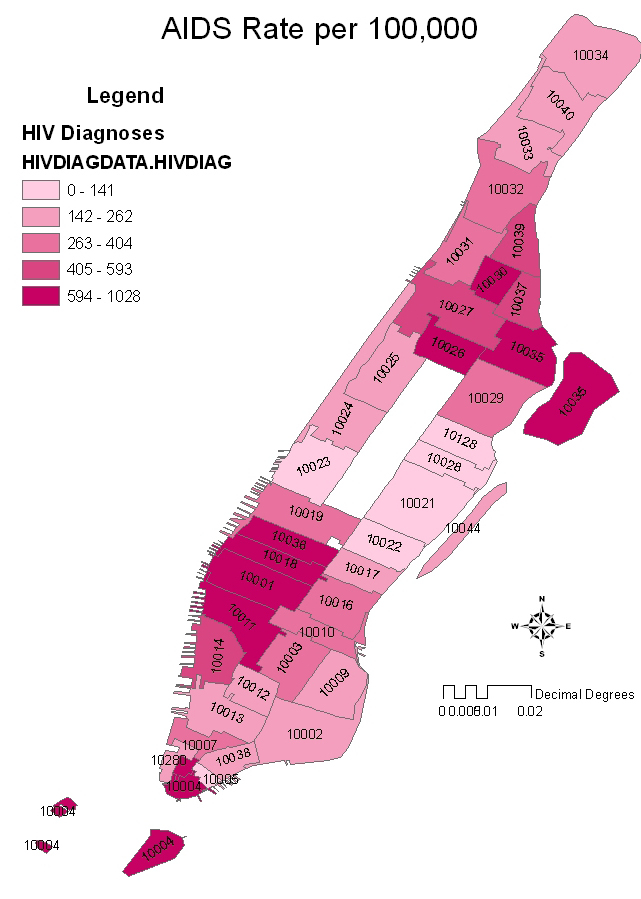
New York City is extremely diverse, with people representing countries, cultures, sub cultures, colors and ways of life from around the world. In a city that is so impossible to define or place in one category, we find that it is also impossible to create a single profile of the HIV/AIDS community. While mapping the AIDS data on the whole highlights the distinct patterns in Manhattan, correlations are hard to draw from such a diverse borough (Map 1). Thus, for the purpose of gathering correlations, I have divided the island of Manhattan in half with Downtown encompassing approximately everything south of 96th Street and Uptown encompassing everything to the north of 96th Street.
To determine how AIDS affects the populations of Manhattan social and economic factors were correlated with the AIDS rate per 100,000. In order for a correlation coefficient to demonstrate a correlation the coefficients must have met the significant values at p=. 05, which in turn is dependent on the number of zip codes. Using the significant value at p=. 05 the correlation ensures that the independent factor affects the AIDS rate at least 95 percent of the time.
Downtown – 25 zip codes
df = 23 ® p=.05 at 0.396
Uptown – 15 zip codes
df = 13 ® p=.05 at 0.514
Mode of Transmission & Lifestyle Variables