Tables, Maps and Graphs
![]()
![]()
![]()
![]()
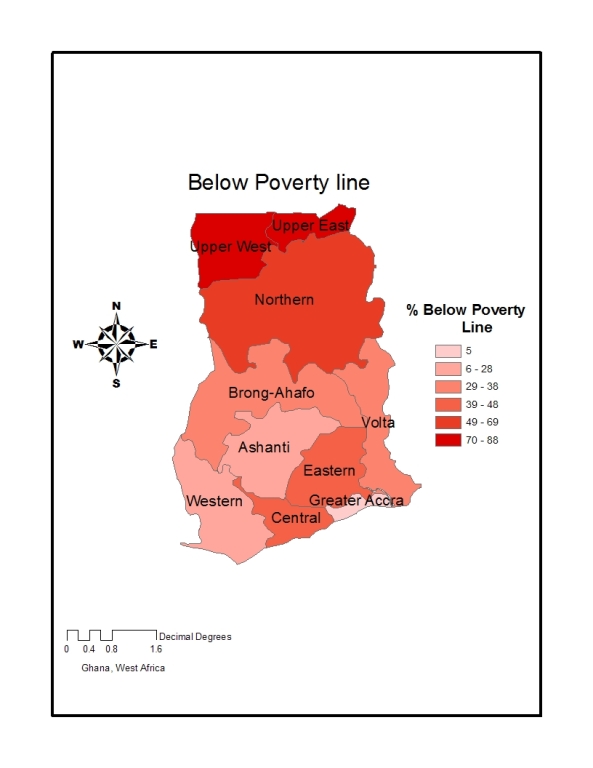
Table 3
|
Region |
% Below Poverty Line |
Cumulative AIDS Rate |
|
Ashanti |
28 |
535.0 |
|
Greater Accra |
5 |
382.2 |
|
Eastern |
44 |
447.1 |
|
Brong Ahafo |
36 |
289.9 |
|
Western |
27 |
267.9 |
|
Central |
48 |
266.6 |
|
Northern |
69 |
175.7 |
|
Upper East |
88 |
308.2 |
|
Volta |
38 |
148.2 |
|
Upper West |
84 |
216.6 |
Graph 2

Map 3
back to AIDS and % Below poverty line<<