EDUCATION

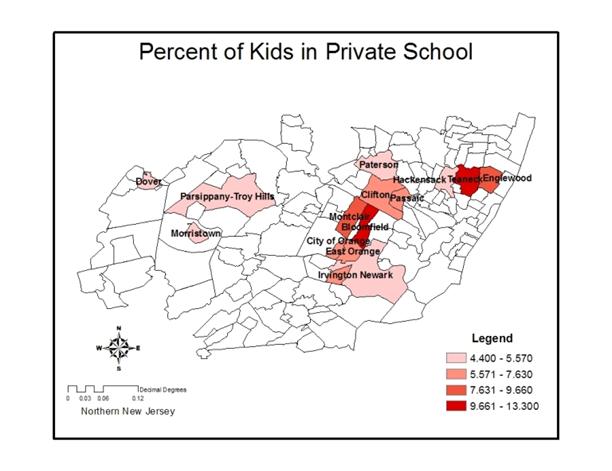
Lastly, I correlated education data to AIDS rates. This included percent of children enrolled in private school and percent of the population that did not receive a high school diploma. I thought that high percentages of children in private school would negatively correlate to AIDS rates, as higher numbers of children enrolled in private school generally signifies a population where the income is high. This was inaccurate, as the correlation between the two is -0.21. After removing the apparent outliers that represent the cities of Bloomfield and Teaneck, a correlation coefficient of 0.016 is obtained. This number is insignificant at any high confidence level.

Graph Before Outliers Removed:                                                                                                   Graph After Outliers Removed:


Town/County

Percent of Kids In Private School

AIDS Rate per 100,000

Bloomfield/ Essex County

13.3

386

Clifton/ Passaic County

6.25

253

Dover/ Morris County

4.4

174

East Orange/ Essex County

6.36

3070

Englewood/ Bergen County

9.66

536

Irvington/ Essex County

6.57

2059

Hackensack/ Bergen County

5.05

399

Montclair/ Essex County

8.82

839

Morristown/ Morris County

4.85

442

Newark/ Essex County

5.39

3398

Orange/ Essex County

7.5

1795

Parsippany/ Morris County

5

384

Passaic/ Passaic County

7.63

764

Paterson/ Passaic County

5.57

1418

Teaneck/ Bergen County

11.23

425

Correlation Coefficient

-0.206016171

(0.016349716 without outliers)


*Outliers in bold


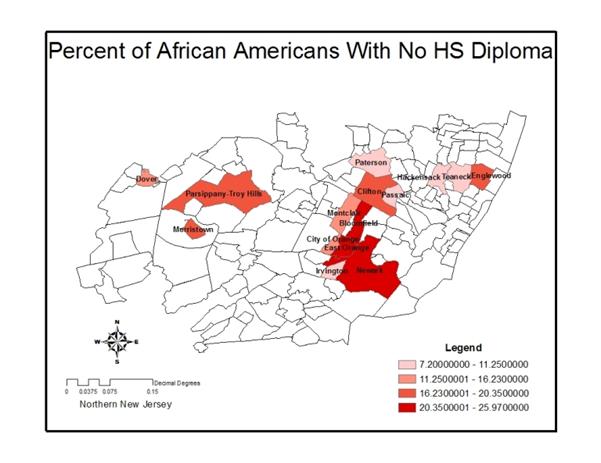
However, the correlation for African Americans who did not receive a high school diploma and AIDS rates was significant at 95% with a value of 0.638.


Town/County

Percent of African Americans with No HS Diploma

AIDS rate

Bloomfield/ Essex County

11.25

386

Clifton/ Passaic County

7.20

253

Dover/ Morris County

9.77

174

East Orange/ Essex County

20.35

3070

Englewood/ Bergen County

13.98

536

Irvington/ Essex County

19.38

2059

Hackensack/ Bergen County

19.85

399

Montclair/ Essex County

9.20

839

Morristown/ Morris County

16.23

442

Newark/ Essex County

25.97

3398

Orange/ Essex County

17.66

1795

Parsippany/ Morris County

15.01

384

Passaic/ Passaic County

24.41

764

Paterson/ Passaic County

25.84

1418

Teaneck/ Bergen County

9.48

425

Correlation

0.638


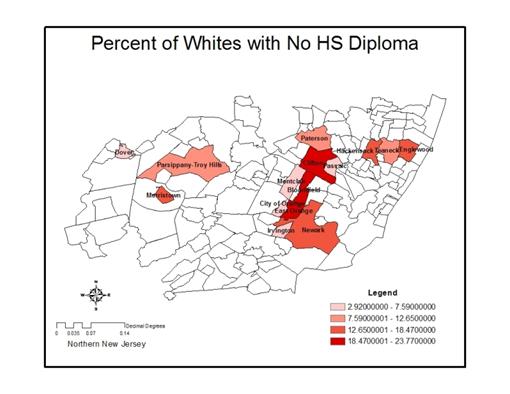
The correlation coefficient for whites who did not complete high school was far less significant at 0.391 (see Appendix 10). However, after removing the outliers of Hackensack at 23.77% and Montclair at 2.92%, the correlation becomes significant at 95% confidence with the value of 0.546. Hackensack is a big city located in Bergen County and has a relatively low median household income of $49,316. This is relevant because low median household income is an indication of low-paying jobs which are normally held by those who do not have high levels of education. Conversely, Montclair is a reasonably wealthy community with a median household income of $74,894 and thus has citizens who most likely hold high-paying jobs and are well educated. It was surprising that the educational data did not correlate well at 99% confidence, as access to good and proper education is not only an indication of financial success and security, but well educated people are also more likely to be aware of risky behaviors that lead to AIDS and avoid them. This educational data was collected using Summary File 3 of the US Census tables P147A-G.

Graph Before Outliers Removed:                                                                                                    Graph After Outliers Removed:

Town/County

Percent of Whites with No HS Diploma

AIDS rate

Bloomfield/ Essex County

10.52

386

Clifton/ Passaic County

12.65

253

Dover/ Morris County

15.56

174

East Orange/ Essex County

16.20

3070

Englewood/ Bergen County

7.59

536

Irvington/ Essex County

10.03

2059

Hackensack/ Bergen County

23.77

399

Montclair/ Essex County

2.92

839

Morristown/ Morris County

6.52

442

Newark/ Essex County

20.99

3398

Orange/ Essex County

16.50

1795

Parsippany/ Morris County

6.02

384

Passaic/ Passaic County

18.47

764

Paterson/ Passaic County

21.40

1418

Teaneck/ Bergen County

5.09

425

Correlation

0.391


*outliers in bold


next