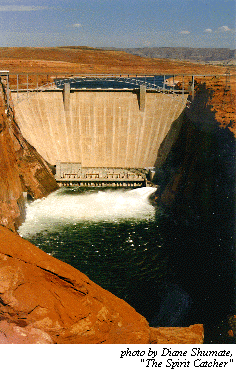
Glen Canyon Dam
Length: 186 miles
Volume: 27 million acre feet at full pool originally. However, after 30 years the
volume is only 25 million acre feet due to sedimentation. One half of volume is
in the top 100 feet of the reservoir. Volume was to equal 2 years average flow of the
river, but now it is less due to sedimentation.
Surface Area: 252 square miles; 161,000 acres, 1960 miles of shoreline.
Historic Floods - in
cubic feet per second (cfs)
Colorado River at Lees Ferry July 7, 1884
300,000 cfs
June
18, 1921 220,000 cfs
Colorado River at Grand Canyon 1862
500,000 cfs (estimated)
In addition, there is evidence of prehistoric floods as
large as 1,000,000 cfs, possibly even greater.
Probable Maximum Floods into Glen Canyon,
Drainage Area 108,000 sqare miles
Type of Flood
Peak Flood (cfs)
Volume (acre feet)
Duration
Rain
417,000
2,063,600 6 days
Snowmelt
196,100
28,460,200
Apr-Jul
Spring (Snowmelt + Rain) 196,100
28,923,900 Apr-Jul
From Colorado River Basin Probable Maximum Floods,
Hoover and Glen Canyon Dams, prepared by the United States Department of Interior,
Bureau of Reclamation, September 1990
Reservoir
Levels and Releases - Bureau of Reclamation Web Site
Glen Canyon Dam Statistics
Designer: Louis Puls
Chief Construction Engineer: Lem Wylie
General Contractor: Merritt Chapman & Scott
Dam Construction Cost: $145,000,000
Total Cost( including power plants, etc.): $272,000,000
Size: 5 million cubic yards / 10 million tons
West Diversion tunnel: 2780 feet long. 41 foot diameter. Plugged with 400
feet of concrete.
Maximum Power Generation: 1300 megawatts with full reservoir, although
operating at full capacity was proven to seriously damage downstream riparian environment
in Grand Canyon.New protocols now reduce operating capacity to between 500 and 800
megawatts annually.
Release Capacity
Each Penstock delivers max 1.3 million GPM.
Dam bypasses, 8 penstocks - 32,000 cubic feet per second (cfs)
4 outlet Tubes - 15,000 cfs
East Spillway - 138,000 cfs
West Spillway - 138,000 cfs
Total possible spill: 323,000 CFS
Dates
April 11, 1956 - Dam authorized.
Oct 1, 1956 - Project begins.
Oct. 15, 1956 - Ceremonial blast.
Feb. 11, 1959 - Cofferdam in place, river diverted.
June 17, 1960 - First bucket of concrete poured.
Jan 21, 1963 - First diversion tunnel closed (west).
March 13, 1963 - Second diversion tunnel closed.
Sept. 13, 1963 - Last bucket of concrete poured.
Sept 4, 1964 - First dynamo operates.
Feb 28, 1966 - Last generator completed.
June 22, 1980 - Lake first filled to 3700 feet.
Lake Powell

recreation
top