Maps
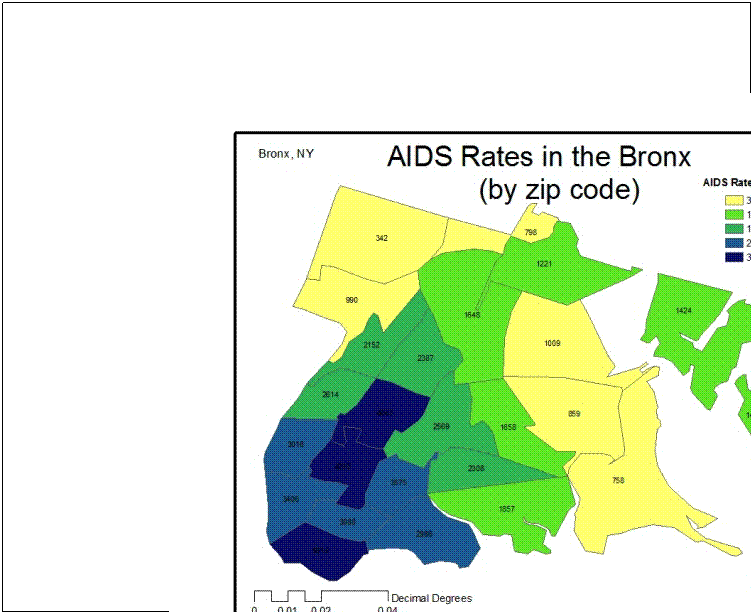
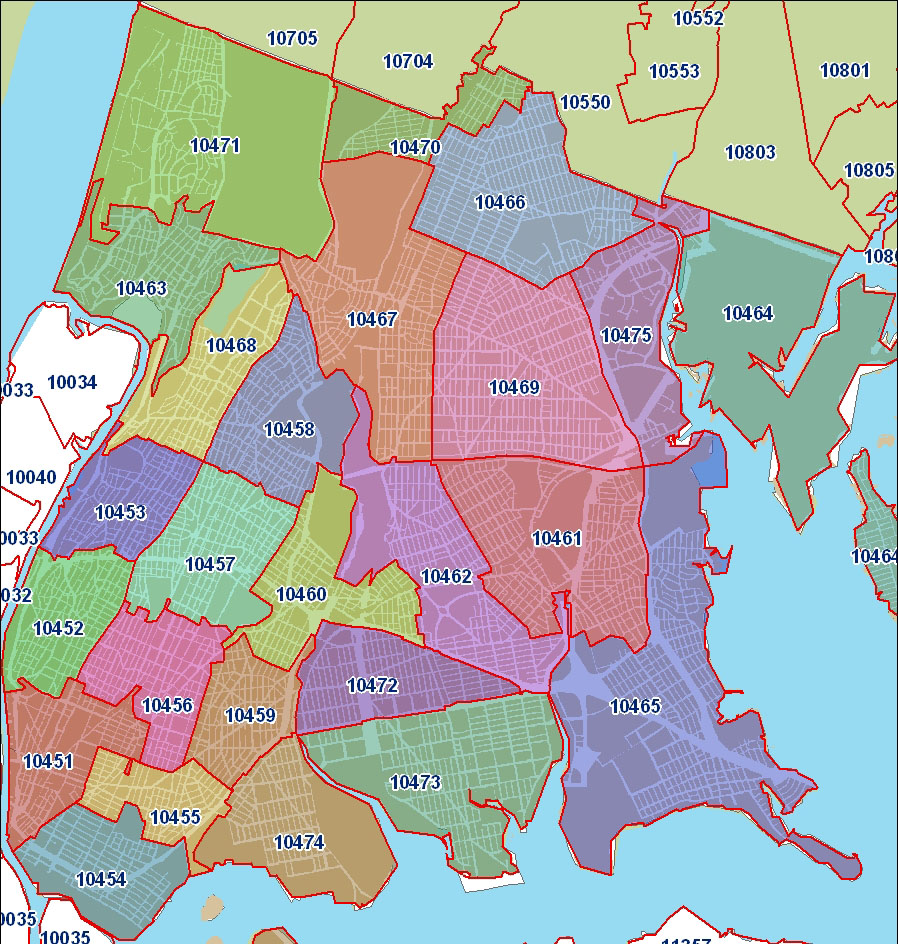


These are the AIDS rates (by zip code) that were correlated with income status, race, etc.

Note that the highest percentages are in some of the same zip codes as the higher AIDS rates. (ie. 10454, 10474, 10459, and 10456)

Note that the highest percentages are in some of the same zip codes as the higher AIDS rates. (ie. 10454, 10474, and 10456)

Here the higher percentages are in the same zip codes as the ones with lower AIDS rates. (ie. 10465, 10461, 10475, and 10470)

Note that the highest percentages are in some of the same zip codes as the higher AIDS rates. (ie. 10454, 10455, 10459, and 10474)
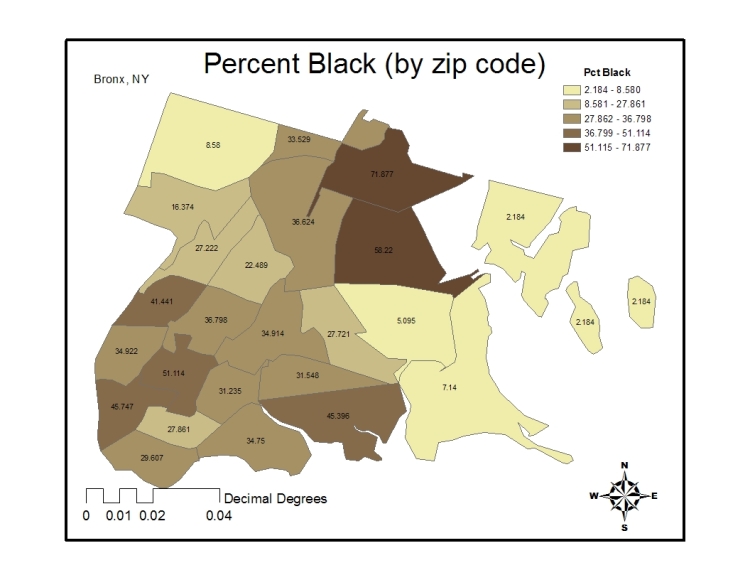

Here the weak correlation can be seen because zip codes such as 10473, 10466, and 10475.
* These maps are meant to show some of the correlations by zip code with AIDS Rates. They help support the ideas presented by showing a concise picture of data.