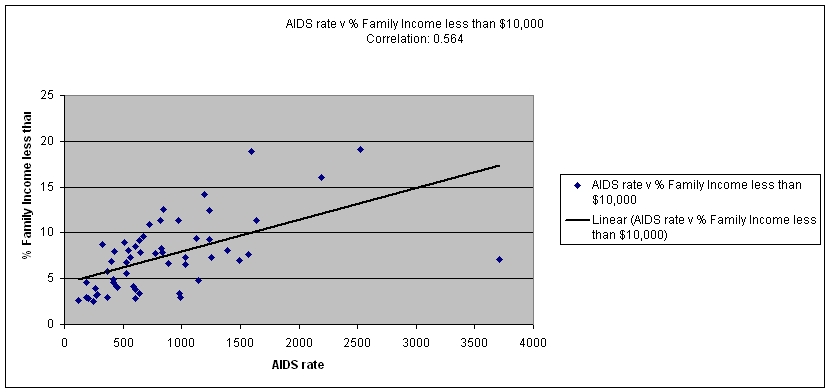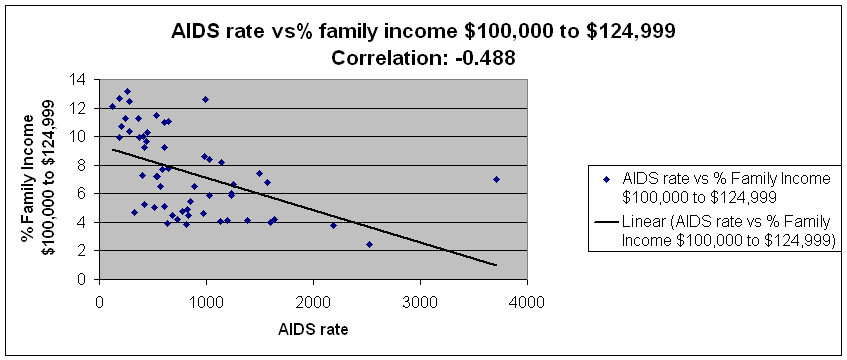
Table A: Correlation Analysis between Cumulative AIDS rates and Family Income
| Zipcode | Total Pop. | AIDSrate | Families: Total | Families: Family income; Less than $10;000 | % Family Income less than $10,000 | Families: Family income; $100;000 to $124;999 | % Family Income $100,000 to $124,999 |
| 11004 Glen Oaks | 14682 | 122.6 | 3798 | 101 | 2.659294 | 459 | 12.08531 |
| 11005 Floral Park | 2195 | * | 569 | 9 | 1.581722 | 61 | 10.72056 |
| 11101 Long Island City | 25595 | 2527.8 | 5625 | 1073 | 19.07556 | 139 | 2.471111 |
| 11102 Astoria | 36291 | 969.9 | 8080 | 917 | 11.34901 | 373 | 4.616337 |
| 11103 Astoria | 44321 | 638.5 | 10105 | 925 | 9.153884 | 395 | 3.908956 |
| 11104 Sunnyside | 29506 | 772.7 | 6908 | 534 | 7.730168 | 330 | 4.77707 |
| 11105 Astoria | 42117 | 543.7 | 10330 | 838 | 8.112294 | 743 | 7.192643 |
| 11106 Astoria | 43130 | 846.3 | 9931 | 1245 | 12.5365 | 541 | 5.447588 |
| 11354 Flushing | 54329 | 423.3 | 13472 | 1069 | 7.934976 | 703 | 5.21823 |
| 11355 Flushing | 83281 | 510.3 | 20821 | 1857 | 8.91888 | 1050 | 5.042985 |
| 11356 College Point | 20444 | 420.7 | 5252 | 238 | 4.531607 | 485 | 9.234577 |
| 11357 Whitestone | 39491 | 276 | 10905 | 344 | 3.154516 | 1130 | 10.36222 |
| 11358 Flushing | 38647 | 191.5 | 9998 | 463 | 4.630926 | 996 | 9.961992 |
| 11360 Bayside | 19350 | 263.6 | 5374 | 213 | 3.963528 | 706 | 13.13733 |
| 11361 Bayside | 29206 | 277.3 | 7485 | 249 | 3.326653 | 931 | 12.43821 |
| 11362 Little Neck | 17502 | 188.5 | 4959 | 147 | 2.964307 | 627 | 12.64368 |
| 11363 Little Neck | 6917 | * | 1911 | 28 | 1.465201 | 205 | 10.72737 |
| 11364 Oakland Gardens | 34539 | 243.2 | 9616 | 241 | 2.50624 | 1083 | 11.26248 |
| 11365 Fresh Meadows | 41566 | 370.5 | 11310 | 650 | 5.747126 | 1122 | 9.920424 |
| 11366 Fresh Meadows | 13366 | 366.6 | 3510 | 105 | 2.991453 | 395 | 11.25356 |
| 11367 Flushing | 38216 | 397.7 | 10076 | 692 | 6.867805 | 737 | 7.31441 |
| 11368 Corona | 98841 | 816.5 | 21446 | 2439 | 11.37275 | 829 | 3.865523 |
| 11369 East Elmhurst | 36110 | 1127.1 | 8299 | 776 | 9.350524 | 338 | 4.07278 |
| 11370 East Elmhurst | 43142 | 3713.3 | 7285 | 519 | 7.124228 | 512 | 7.02814 |
| 11372 Jackson Heights | 71308 | 1386.9 | 16290 | 1311 | 8.047882 | 670 | 4.112953 |
| 11373 Elmhurst | 105723 | 835.2 | 24328 | 1919 | 7.88803 | 1088 | 4.472213 |
| 11374 Rego Park | 44189 | 529.5 | 11181 | 762 | 6.815133 | 804 | 7.19077 |
| 11375 Forest Hills | 70204 | 450.1 | 18079 | 731 | 4.043365 | 1865 | 10.31584 |
| 11377 Woodside | 88339 | 324.8 | 20632 | 1807 | 8.75824 | 963 | 4.667507 |
| 11378 Maspeth | 34053 | 590.3 | 9073 | 378 | 4.166207 | 698 | 7.693156 |
| 11379 Middle Village | 28984 | 414 | 7798 | 385 | 4.937163 | 782 | 10.02821 |
| 11385 Ridgewood | 97524 | 677.8 | 25052 | 2415 | 9.639949 | 1122 | 4.478684 |
| 11411 Cambria Heights | 21282 | 991.4 | 5479 | 164 | 2.993247 | 690 | 12.59354 |
| 11412 Saint Albans | 37452 | 1492.6 | 8717 | 610 | 6.99782 | 644 | 7.387863 |
| 11413 Springfield Gardens | 39827 | 984.3 | 10300 | 350 | 3.398058 | 890 | 8.640777 |
| 11414 Howard Beach | 28121 | 441 | 7872 | 326 | 4.14126 | 762 | 9.679878 |
| 11415 Kew Gardens | 20956 | 1030.7 | 4717 | 343 | 7.271571 | 276 | 5.851177 |
| 11416 Ozone Park | 23668 | 726.7 | 5780 | 631 | 10.91696 | 244 | 4.221453 |
| 11417 Ozone Park | 28607 | 566.3 | 7134 | 525 | 7.359125 | 464 | 6.504065 |
| 11418 Richmond Hill | 36571 | 825.8 | 8579 | 710 | 8.276023 | 420 | 4.895675 |
| 11419 South Richmond Hill | 48867 | 603.7 | 11461 | 977 | 8.524562 | 583 | 5.086816 |
| 11420 South Ozone Park | 45498 | 885.8 | 10935 | 727 | 6.648377 | 713 | 6.520348 |
| 11421 Woodhaven | 37664 | 647.8 | 9199 | 720 | 7.826938 | 714 | 7.761713 |
| 11422 Rosedale | 30449 | 640.4 | 7380 | 247 | 3.346883 | 817 | 11.07046 |
| 11423 Hollis | 31240 | 1030.7 | 7369 | 484 | 6.568055 | 617 | 8.372914 |
| 11426 Bellerose | 18727 | 202.9 | 4692 | 135 | 2.877238 | 503 | 10.72038 |
| 11427 Queens Village | 23014 | 604 | 6030 | 171 | 2.835821 | 557 | 9.237148 |
| 11428 Queens Village | 21023 | 604.1 | 5034 | 190 | 3.774335 | 553 | 10.9853 |
| 11429 Queens Village | 27647 | 1139.4 | 6488 | 309 | 4.762639 | 531 | 8.18434 |
| 11430 Jamaica | 229 | * | 20 | 0 | 0 | 0 | 0 |
| 11432 Jamaica | 57045 | 1256.9 | 12614 | 923 | 7.317267 | 842 | 6.675123 |
| 11433 Jamaica | 28435 | 2191 | 6632 | 1061 | 15.99819 | 250 | 3.769602 |
| 11434 Jamaica | 59142 | 1567.4 | 14060 | 1073 | 7.631579 | 958 | 6.813656 |
| 11435 Jamaica | 53877 | 1236.1 | 12590 | 1169 | 9.285147 | 760 | 6.036537 |
| 11436 Jamaica | 18148 | 1636.5 | 4262 | 486 | 11.4031 | 180 | 4.223369 |
| 11691 Far Rockaway | 56184 | 1196.1 | 12277 | 1749 | 14.24615 | 509 | 4.145964 |
| 11692 Arverne | 15893 | 1598.2 | 3753 | 709 | 18.89155 | 150 | 3.996803 |
| 11693 Far Rockaway | 11157 | 1236.9 | 2797 | 347 | 12.40615 | 164 | 5.863425 |
| 11694 Rockaway Park | 19278 | 529.1 | 4648 | 261 | 5.615318 | 535 | 11.51033 |
| 11697 Breezy Point | 4226 | * | 1206 | 42 | 3.482587 | 159 | 13.18408 |
| 0.563877 | -0.48761 |

