My Correlations
Table
| City | Pop. | Cumulative Cases | Rate/100,000 | Perc. On Pub. Ass. | Perc. Of White Pop. | Perc. Of Mix | Perc. Of Married Couples | Perc. Female | Perc. In Poverty |
| Barneveld(13304) | 2,192 | 3 | 138.76 | 2.215657312 | 97.97336422 | 0 | 82.68398268 | 9.307359307 | 4.053271569 |
| Booneville(13309) | 5,942 | 3 | 50.488 | 4.474272931 | 99.03569616 | 0.879715784 | 77.62148338 | 13.61892583 | 11.83246073 |
| Camden(13316) | 6,664 | 3 | 45.018 | 4.241435563 | 98.89057751 | 0.258358663 | 80.24971623 | 11.18047673 | 12.02628362 |
| Marcy(13403) | 7,919 | 11 | 138.906 | 3.365079365 | 63.59959555 | 2.022244692 | 83.63787375 | 9.38538206 | 5.569245934 |
| New Hartford(13413) | 15,871 | 6 | 37.804 | 1.141045959 | 94.38972697 | 1.072185513 | 86.02176542 | 10.71342201 | 5.579883227 |
| Oriskany Falls(13425) | 1,970 | 3 | 152.284 | 5.943152455 | 98.75373878 | 0.498504487 | 78.11934901 | 13.92405063 | 9.74025974 |
| Rome(13440) | 44,797 | 49 | 109.382 | 6.266651222 | 89.41811932 | 2.178425552 | 74.57883947 | 19.76111953 | 12.45923815 |
| Vernon(13476) | 3,219 | 5 | 155.328 | 3.935742972 | 98.39407041 | 0.061766523 | 77.23112128 | 17.50572082 | 9.474992234 |
| Whitesboro(13492) | 11,555 | 4 | 34.62 | 2.817810282 | 98.61743087 | 0.341267063 | 82.52730109 | 13.5725429 | 6.770558197 |
| Utica(13501) | 36,076 | 111 | 307.683 | 9.685279188 | 76.51272124 | 3.987831858 | 63.5830007 | 29.87790561 | 26.24945926 |
| N.Utica(13502) | 33,505 | 79 | 235.79 | 6.593889662 | 87.64723558 | 1.932091346 | 69.85320878 | 22.84362489 | 18.10281713 |
| Correlation Coefficient | 0.764156502 | -0.504288399 | 0.663383125 | -0.80962084 | 0.771854789 | 0.714799938 | |||
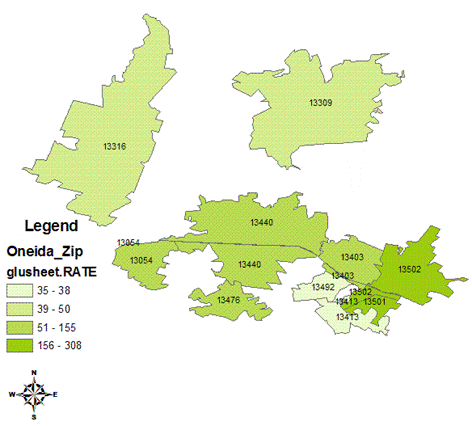
The AIDS epidemic is an ever increasing threat to today’s society. Every region is affected differently by the AIDS pandemic, depending on individual way of life in that region. Acquired Immune Deficiency Syndrome, is not picky, its victims vary from person to person and town to town. To effectively combat the disease, we must first learn where to attack, areas to improve education of the disease, and areas in need of immediate treatment. In Oneida County, each city is below the national average for cumulative AIDS cases of 328.711 (rate per 100,000). As you begin to analyze Oneida County and each city within the jurisdiction, AIDS becomes a bigger issue within certain cities of the county. Referring to Map 1, you can see that cases range from 35 to 308, and the higher ranges are centralized in the most urban of areas.
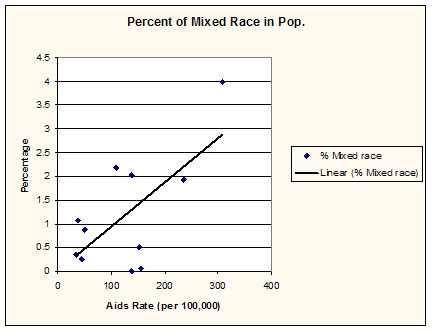
As I analyzed Map 1, I realized that Utica, NY (13501-13502) was always left out of the trend line, the trend is a normal line drawn onto the correlation scatter plot, displaying a line of normality. I began to think: What was there in Utica that would throw off the correlations? I chose to correlate the percent of mixed race and the rate of AIDS cases. I chose to correlate these two entities, because of the diversity I see in Utica. As portrayed by Graph 1, a positive correlation is seen between the percent of mixed race and rate of AIDS cases, and the outliner always seems to be Utica (13501). Utica indeed has the highest percent of mixed races, and also the highest rate of AIDS cases in the Oneida County.
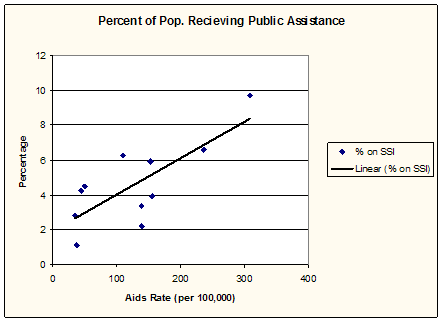
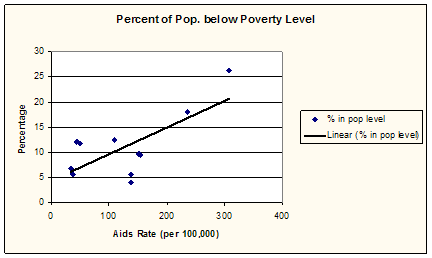
Next I decided to correlate the percent of the population in each city, living in poverty, to the AIDS rate. When correlated, the data displays that in Utica, there is a high percentage of poverty and also a high rate of AIDS cases. More so, in Map1 we saw that AIDS rates were highest amongst the more urban region of the county. Usually in such cities, there is an abundance of economical disadvantages. To further this argument, I also correlated the percent of the population receiving public assistance (Graph 2) to AIDS rate. The area with the highest percentage was in Utica, as you can see in the map. Usually low income levels are associated with higher poverty levels, in which as supported by data, results in a higher rate of AIDS cases. In areas such as Utica, the surrounding provinces are seemingly much wealthier, and less diverse. By combining these data, I found that in Utica, the people feel more comfortable do participate in various activities, such as unprotected sex and drug injection, resulting in the high appearance of AIDS in that area.
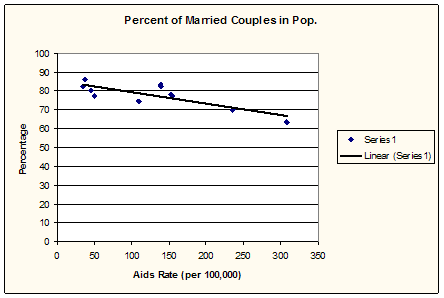
Next I chose to approach certain ways of life. I calculated the percent of the population that are married (Figure 1). When I correlated this with AIDS rate, a negative correlation was displayed on the graph (Graph 3). The negative correlation showed that areas with a greater number of married couples, had a lower rate of AIDS cases and areas of lesser number of marriages, and had higher rates. Even though there was a negative correlation, it helped stress the point, that AIDS does affect everyone, but is more likely to affect unmarried couples: why? Homosexual relationships are not allowed to marry, at least not recognizable by law, and also having children and a family mature people, making it less likely for parents to engage in risky behavior.
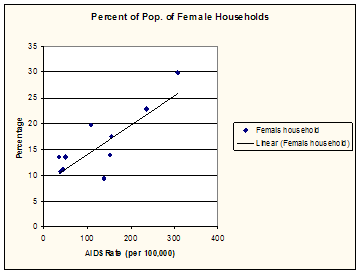
Next, I chose to correlate AIDS rate to the percent of households, where the female was head of the house. The results, displayed in graph4, show that in most cities the AIDS rate and percent of females householders were equally low. Utica however, again was the outliner. When you remove Utica from the data, the correlation becomes insignificant, due to the fact that the data is just a gradual increase. In Utica, possibly with no father figures in the home, young adult males (Table 3) are misguided, resulting in the use of drugs. With no father figure to dissipate lifestyles adherent to those surrounding them, results in peer pressure. Older friends, or neighbors now become influences and not always modeling what is right.
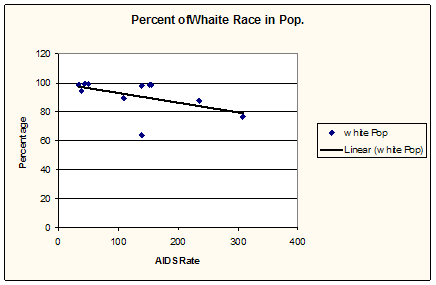
Following that correlation, I correlated the percent of the total population that was African-American to the rate per 100,000 of AIDS cases. A correlation between the two was non-existent. I asked myself why, and began to look at the total African-American population of each city. Utica had the highest population and most other cities were far behind. I concluded that the majority of the African-American population in Oneida County resided in Utica and not really in any other place, resulting in almost a centralized data chart. I then decided to correlate the percent of White race in the population. These numbers did correlate. The correlation showed that as the percent of white race decreased the rate of AIDS cases increased. However, Utica did not have the lowest percent of the white race, but indeed the highest rate of AIDS cases. Marcy, NY (13403) had a white population percent of 64, with a low AIDS rate of 138. After research, I found that in Marcy, there was a high population of Asian descent, previously moved into the area; attending State University and Institute of Technology.
In conclusion
Oneida County does not have an AIDS crisis, which made it difficult to find
correlations. Most correlations, where found in Utica, NY, one of the bigger
cities. In bigger counties which are urbanized there is a higher rate of people
living in poverty and more of a diverse culture. In the smaller counties it
is
just not as significant. Smaller counties also tend to be more conservative.
Gay men may move to the bigger cities to feel more accepted and the highest rate
of HIV/AIDS transmission is through male to male sexual contact (Table 3). In bigger
cities there is more privacy and individualism. The population is so high that
people do what they want to do without the judgmental characteristic of a little
community. In Oneida County, a lifestyle of drug use or homosexuality, is looked
down upon and sometimes seen as immoral. In a bigger city one has the seclusion to have their
sexual preference, engage in multiple sex partners, or partake in injection drug
use, due to the fact that there are more individuals who share in that
lifestyle.