correlations and their relation
![]()
![]()
![]()
![]()
![]()
![]()
![]()
![]()
![]()
![]()
![]()
![]()
![]()
The results of my analysis of AIDS in Lawrence as well as Essex County amazed me. What I had thought was an epidemic for the nation also appears to be an epidemic for my county. According to the data I gathered, white men in Essex County cumulatively accounted for 60% of the total AIDS cases. Lawrence had the highest AIDS rate, but since the amount of white men in Lawrence is limited, how could the high percentages of white men match with the scare amount of them in the city? The correlations within the Essex County are considered significant if they are or greater than the numerical value of ± 0.404. Through the graphs, correlations between AIDS and other factors may be seen, and through the maps a relation between each city’s AIDS rate and the percentage being analyzed can be depicted.
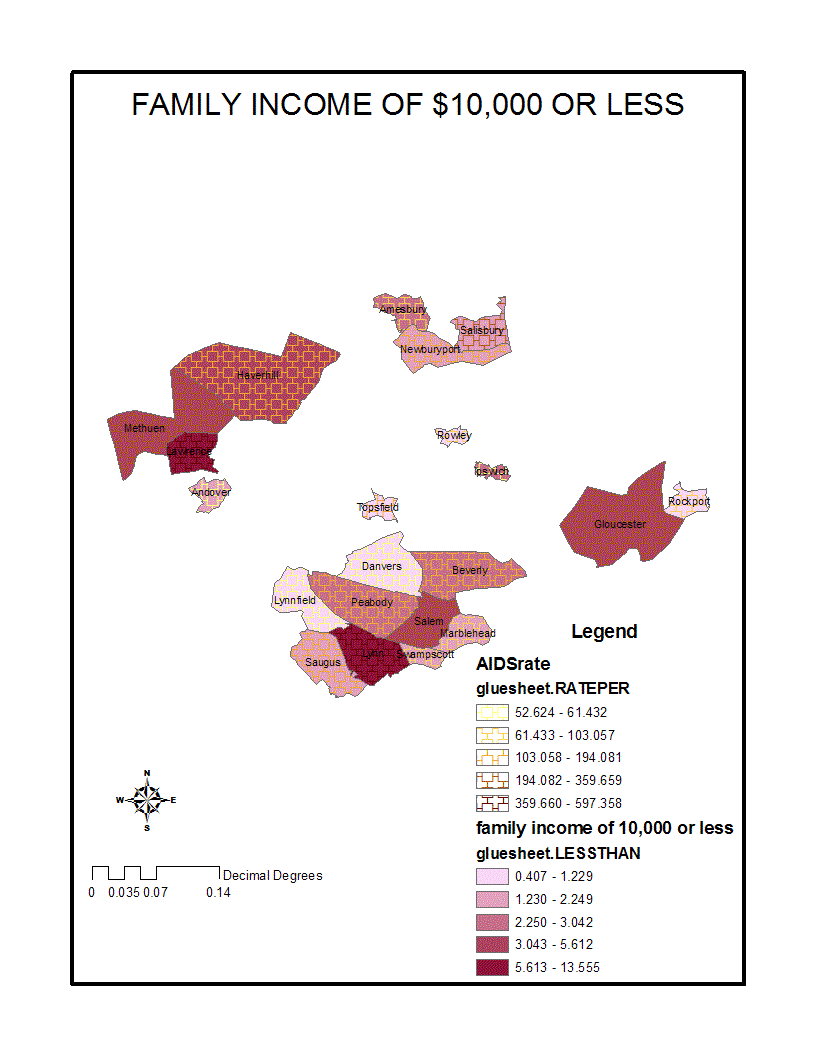
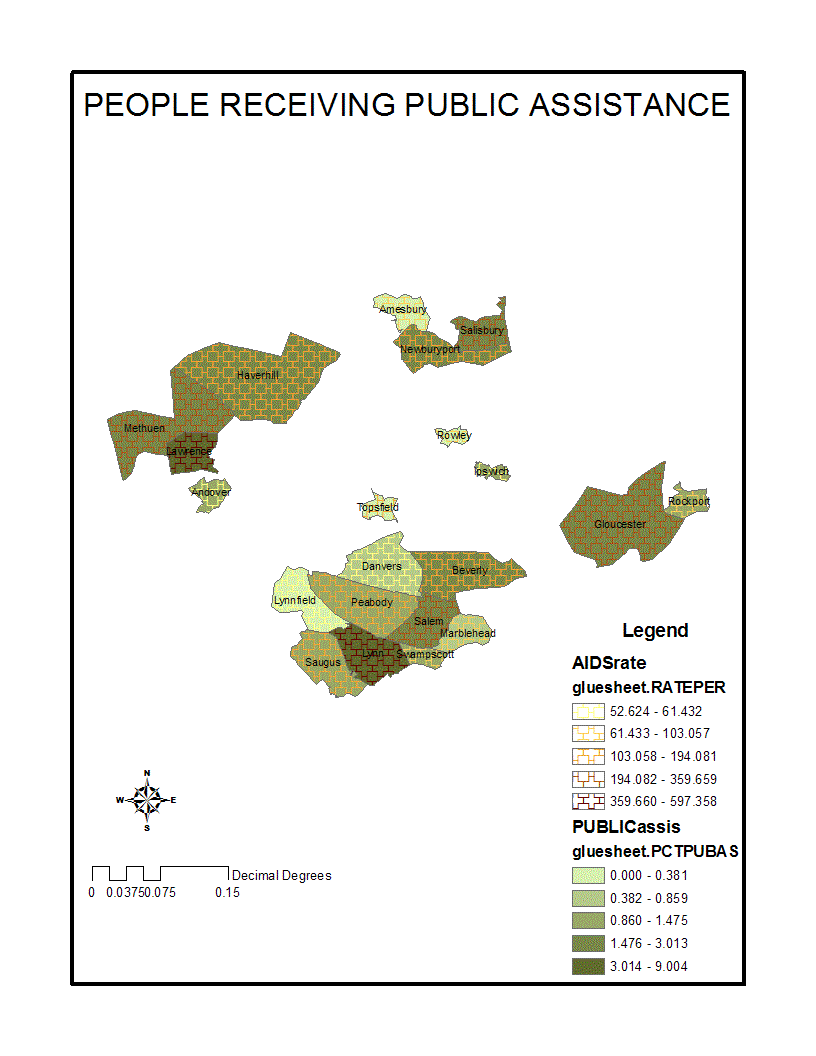
There had to have been other factors leading to frequencies of AIDS cases in various cities and towns of Essex County. Several factors were correlated: families with public assistance; unmarried households; relatively large families; householders by age; time leaving to work; relatively large and small family incomes; and employed white men. Different aspects of the city of Lawrence are problems, and from those aspects relationships between them and the AIDS epidemic may be evident. These flaws included poverty and child supervision. Assuming that families with low income most likely did not attain a good education, such people would not be aware of chronic diseases that can affect anyone and everyone. Indeed, families with income lower than $10,000 correlated very strongly with a coefficient of 0.8598 with the increasing cumulative AIDS rate in each city. The positive coefficient shows the relationship between the two factors: as one increases, the other increases as well. In addition, once people begin to drop below poverty level, it is only necessary to provide public assistance for those individuals. Therefore, people receiving public assistance should correlate similarly. The percentage of people receiving public assistance produced a similarly strongly significant correlation coefficient of 0.885, relatively close to 0.8598. This may tells us that the more financially deprived citizens, the possible increase in AIDS.
_files/image002.gif)
_files/image004.gif)
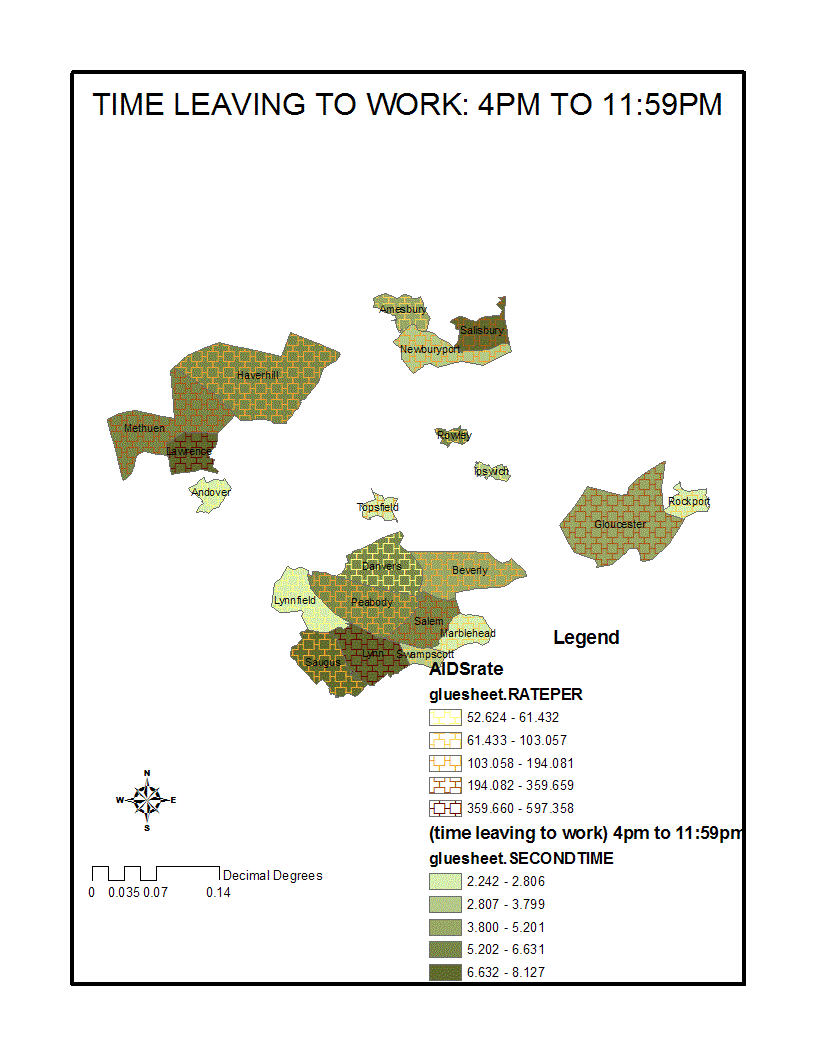
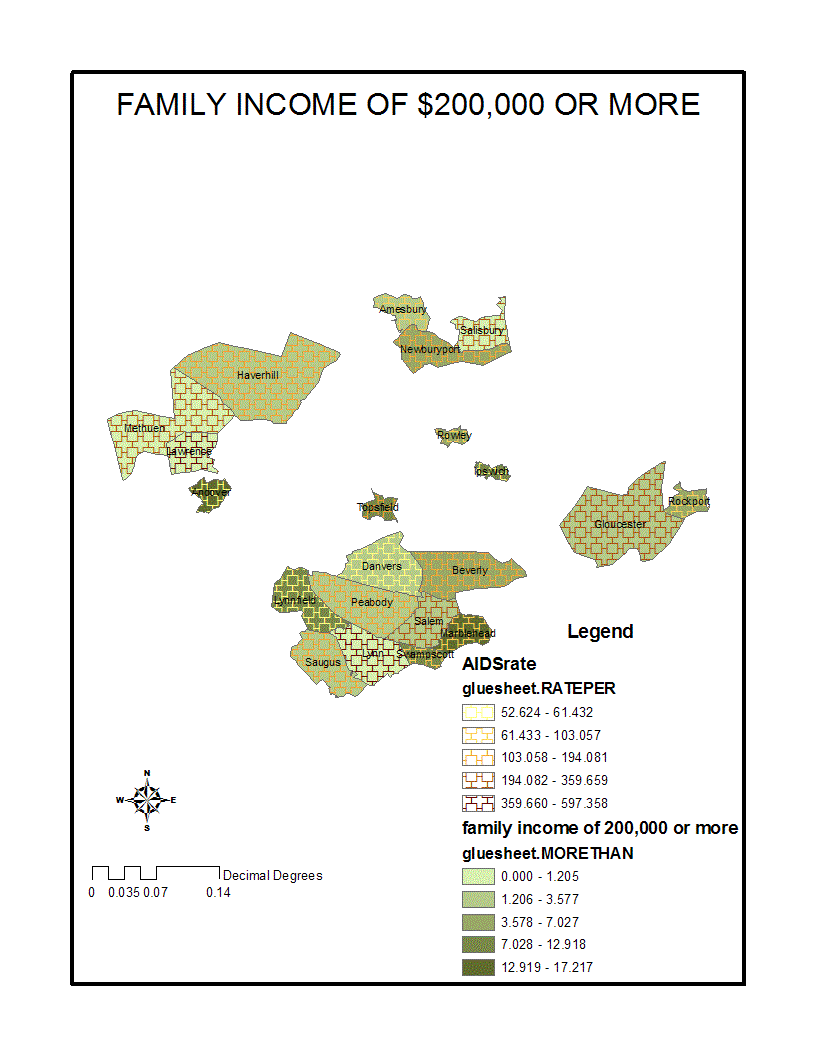
Another correlation with strong coefficients was that of people who leave to work at different times. People who leave to work between 4:00 p.m. and 11:59 p.m. generated a correlation coefficient of 0.614. Through the graph, it is notable that the more people who leave to work between 4:00 p.m. to 11:59 p.m., the higher the AIDS rate. Through the map, the darker shaded cities: more people leaving to work in that time frame match with the darker shaded boxes: higher AIDS rate. The rates of teenage parents are comparatively high in Lawrence6, so it may be that teens need to understand how to control themselves. Knowing this about my city, factors such as time leaving to “work” may be just the pretense of a disobedient adolescent. Moreover, it would also be likely that parents who leave to work at such late times may have to leave their children unattended, which can result in a range of factors. As for the people who leave to work between 12 p.m. to 3:59 p.m., another positive linear trend correlated. An even more significant correlation coefficient of 0.841 was produced. If both times leaving to work produced a significantly positive coefficient, then there should be some relevant relationship between these times and the AIDS rate. Quite opposite to family income less than $10,000, is the correlation between the AIDS rate and family income of $200,000 or more. If I had predicted that the more families with an income less than $10,000 were at greater risk of contracting AIDS, then fewer families with an income greater than $200,000 would contract AIDS. My deduction proved true for family incomes more than $200,000 in which the relation produced a nearly perfect correlation coefficient of -0.567, which means the graph of the correlation is negative. The negative correlation suggests that AIDS rate per 100,000 increases, the income more than $200,000 decreases.
_files/image006.gif)
_files/image008.gif)
_files/image010.gif)
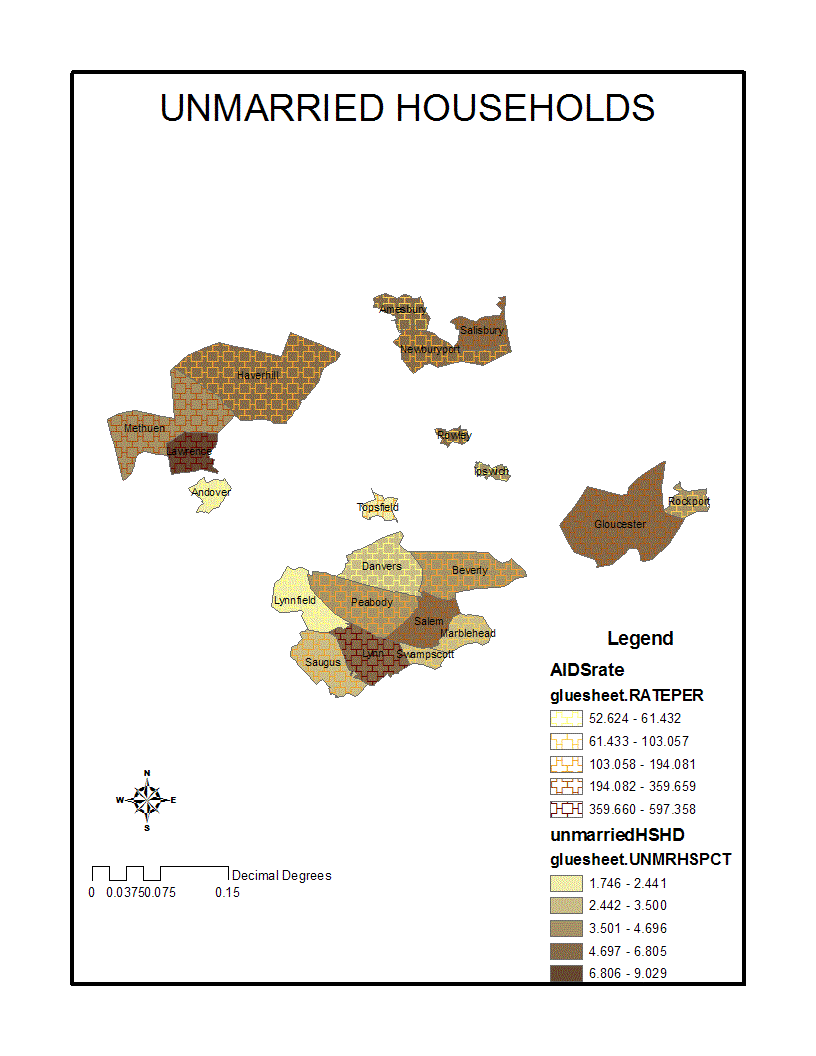
Significant correlations included unmarried households, householders between the ages 15 to 24 as well as householders between the ages 25 to 34. I had decided to correlate unmarried households because I looked at many aspects of the AIDS epidemic as well as humanity in general. The unmarried household percentage correlated with a coefficient of 0.689. The higher value of the coefficient suggests that, in relation to 0.404, as the AIDS rate increases, the even greater unmarried household percentages. The map proves that areas with higher AIDS rates occur in areas with a large amount of unmarried couples.
_files/image012.gif)
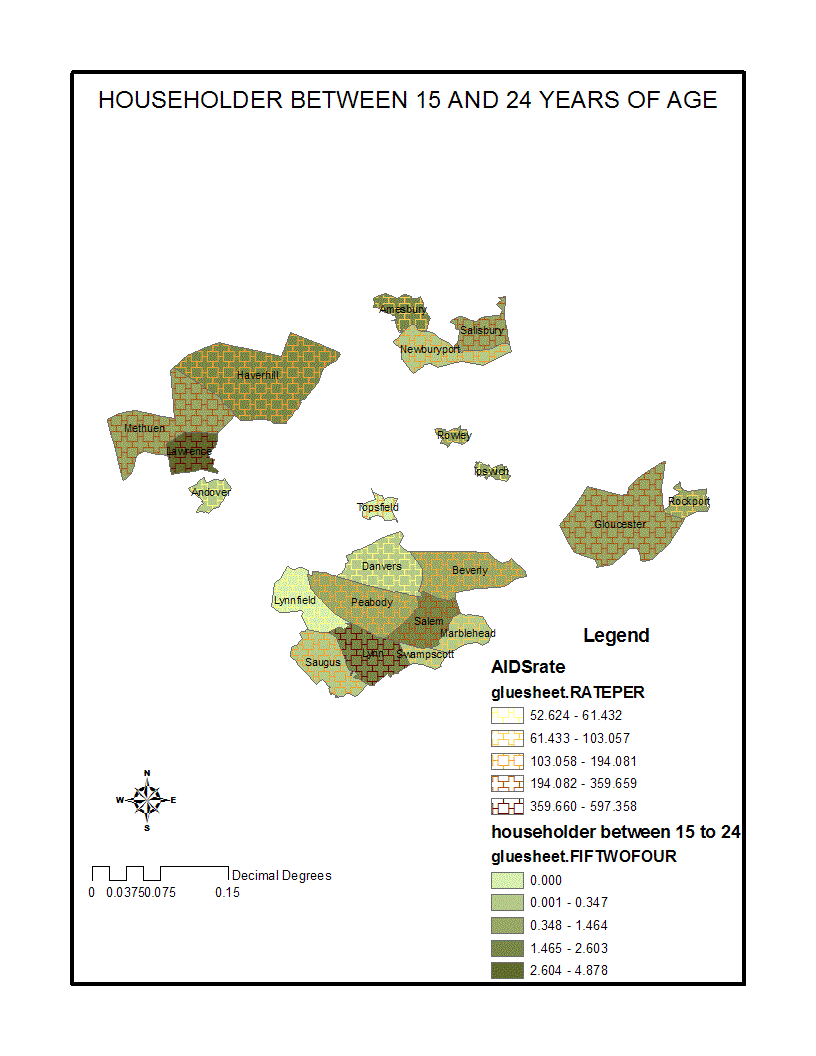
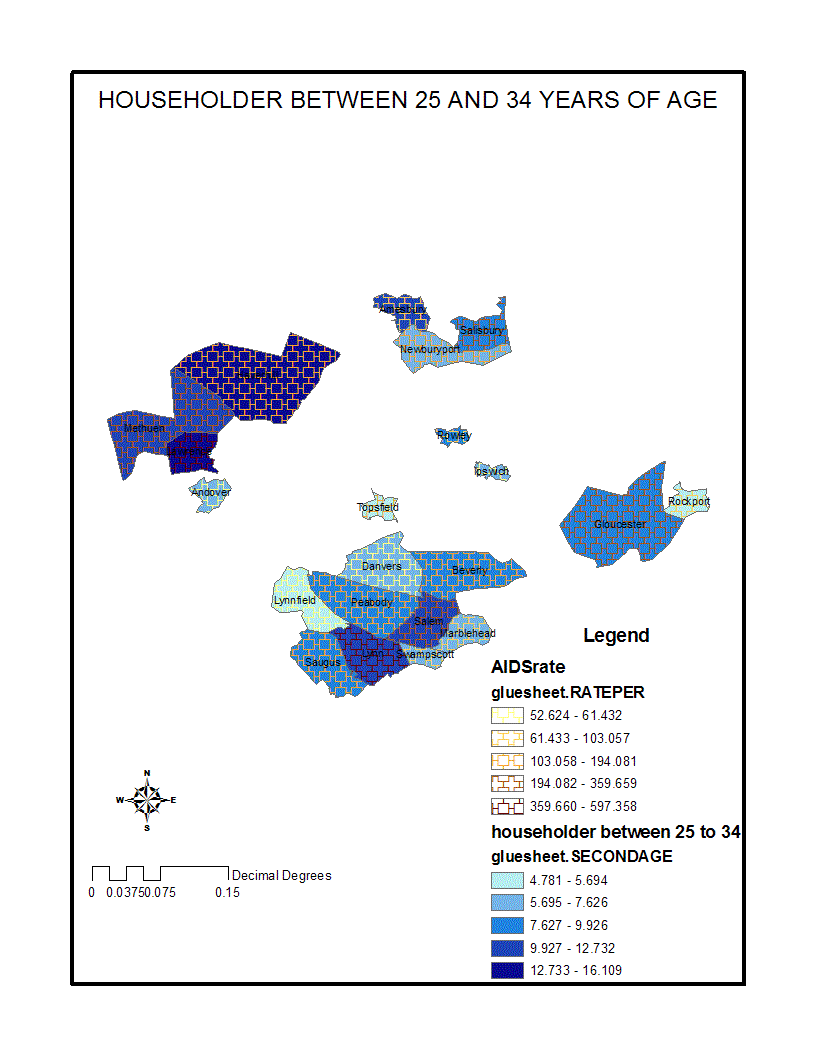
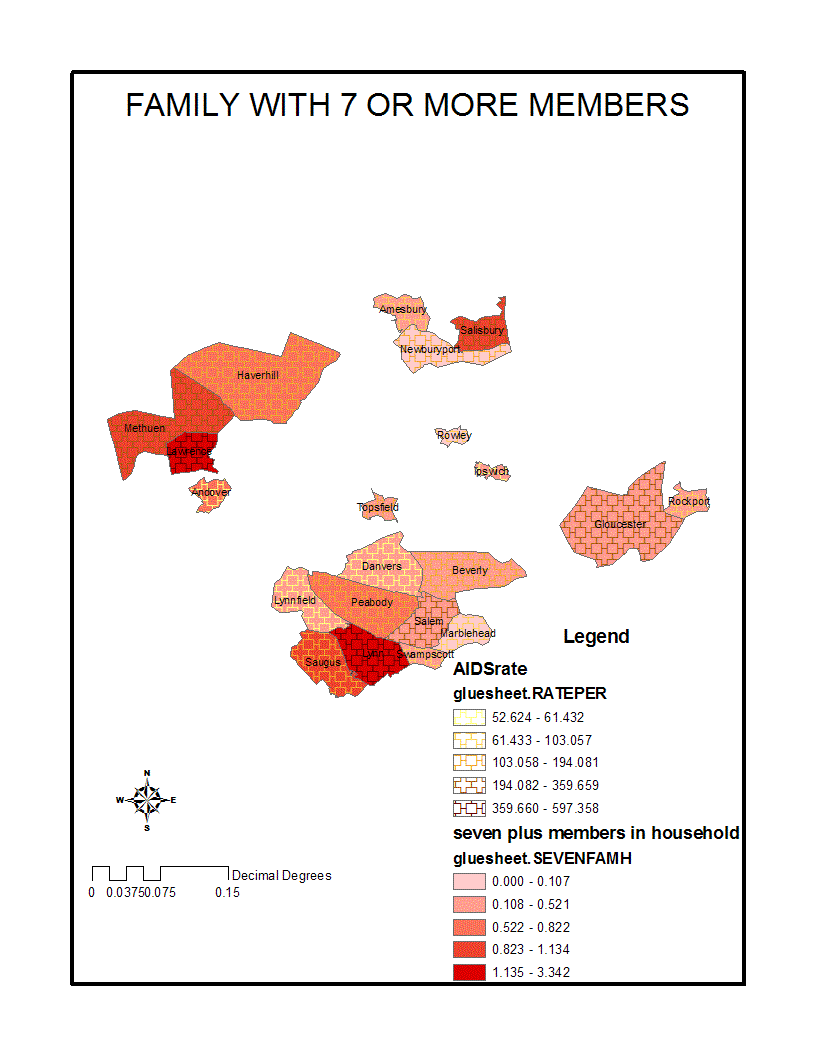
Two of the most closely correlated factors in relation to the AIDS rate per 100,000 in Essex County are householders between the ages 15 and 24, and householders between the ages 25 and 34. The correlation coefficient for householders between the ages 15 and 24 is 0.767 and the coefficient for householders between the ages 25 and 34 is 0.612. I decided to correlate householders by their age because when one has their own space, they are free to do anything. People between their teenage years and their mid-thirties tend to be much more socially experimental, which may lead to greater sexual activity. A fact to take into account is the people between 25 and 34 have a stronger correlation coefficient in relation to the AIDS rate, which may be due to the fact that older people usually have more money because they have worked longer, which allows them to participate in a vast amount of activities. Aside from the householder’s age, I thought I would correlate the size of the households. I know that in my city, as well as many of the surrounding cities within Essex County, the smaller the household, the more concentrated the parents are with the child. However, what would happen if there were too many children to control? To answer this, a correlation between the percentage of family households who have seven or more family members and the AIDS rate was produced. I expected the rate correlate somewhat, and remarkably, they did! The correlation coefficient of family households who have seven or more family members yielded a substantial 0.814.
_files/image014.gif)
_files/image016.gif)
_files/image018.gif)
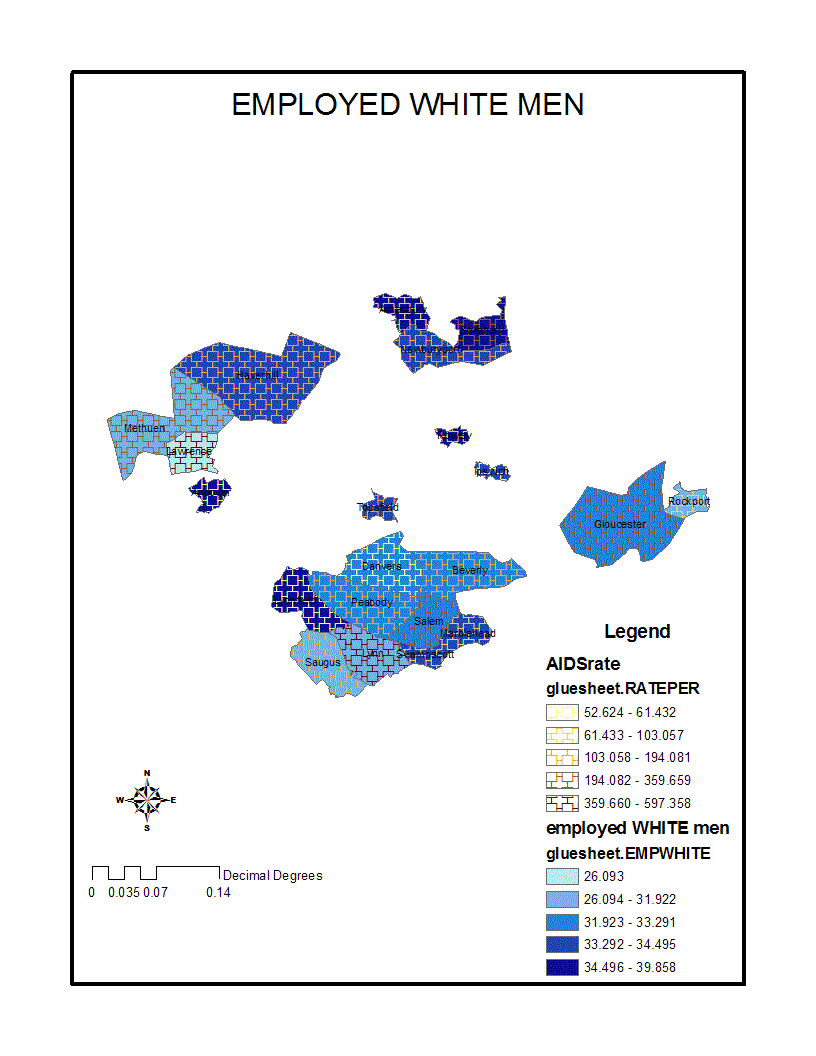
Although, in my initial perceptions of AIDS, I felt that race/ethnicity would not play a strong part in the AIDS epidemic in my county, I knew I had to consider it in some way. Therefore, I decided to correlate employed white men, which yielded -0.609; a significantly negative value. Consequently, the higher the AIDS rate in Essex County, the possibly less employed white men percentage. According to the graph of this correlation, it is notable that the rate of employed white men may be considerably related to the AIDS rate in Essex County. This may be because removing these men from the sexual environment and having them work decreases the possibility for them to infect or contract AIDS.
_files/image020.gif)
AIDS is obviously a problem in Essex County. Although some cities’ AIDS rates are relatively low, AIDS is still a problem overall. It would only take one person to infect hundreds, and if that were to happen in cities such as Lawrence, Lynn, or Salem, there would not be space to feel safe. By this, people would be forced to consider getting tested for HIV/AIDS before engaging in any sexual activity. I believe that the more locations that promote/conduct HIV testing, the safer the community is as a whole.