Correlations
In Santa Ana there has never really been much talk about AIDS or HIV, yet there is clearly a problem in Santa Ana since the city’s AIDS rate per 100,000 people is higher than the national rate. Although there is not much of a difference between the two rates, Santa Ana still has a higher rate and not much is being done to improve the current situation. The media is doing the minimum to spread the awareness; the Orange County Register published very few articles and there are no posters or public announcements to make spread the awareness. Discovering that my hometown has a problem with AIDS I had to figure out if there were any connections on how people are getting AIDS. I searched to see if it had to do with people surviving on a low income, people living under the poverty line, and even how many people are living per household or what type of relationship they are in. This data was taken from the 2000 census on the Census Bureau to figure out the correlations between the given subjects and the AIDS rate per 100,000 people. Using excel we determined if the correlation was significant or not. In order for the correlation to be significant it would have to render a number greater than .444 or lower than -.444.
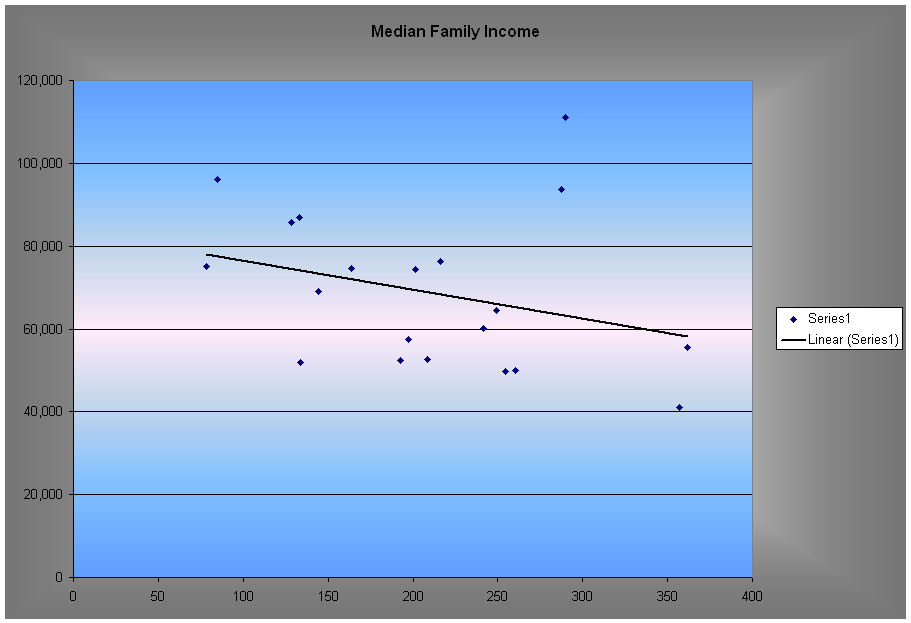
One important connection that seemed relevant was to compare the average family income for each city; at first glance it seemed as if it really was not significant. However, if you look at the graph 1,
Graph 1a.
 With
the Outliers
Graph 1ab
 Without
the Outliers
you can see that overall the graph generally follows the trend line. If you were to remove Newport Beach and Laguna Niguel you would get an extremely significant correlation of -0.699 (graph 1b.), which means that the less people make during the year, the greater the amount of cases would result.
Table 1.
|
City |
Rate per 100,000 people |
Median family income in 1999 |
|
Lake Forest |
78.355 |
75,121 |
|
Yorba Linda |
84.864 |
96,132 |
|
Placentia |
144.123 |
68,976 |
|
La Habra |
133.957 |
51,971 |
|
Fountain Valley |
163.702 |
74,502 |
|
San Clemente |
216.277 |
76,261 |
|
Mission Viejo |
133.187 |
86,902 |
|
Buena Park |
192.892 |
52,327 |
|
Tustin |
241.467 |
60,092 |
|
Laguna Niguel |
287.602 |
93,613 |
|
Irvine |
128.607 |
85,624 |
|
Westminster |
208.6 |
52,677 |
|
Fullerton |
197.614 |
57,345 |
|
Orange |
249.183 |
64,573 |
|
Huntington Beach |
201.483 |
74,378 |
|
Costa Mesa |
361.466 |
55,456 |
|
Newport Beach |
289.867 |
111,166 |
|
Garden Grove |
254.243 |
49,697 |
|
Anaheim |
260.66 |
49,969 |
|
Santa Ana |
356.829 |
41,050 |
|
Correlation |
|
-0.301456544 |
|
Without Laguna Niguel and Newport Beach |
|
-0.699121251 |
It is evident that the results look the way they are; there could be more reported cases of AIDS by people who are not earning the money to combat the HIV with medication. Moreover in Newport Beach, which is the city that has the most homosexual population, was an outlier in this graph. Newport Beach and Laguna Niguel were the outliers on this correlation, which was skewing the initial correlation. Newport Beach and Laguna Niguel are two of the wealthiest cities in Orange County, yet why is it that they have one of the worst cases of AIDS? Since people in Newport Beach are wealthy they can go on a regular basis to clubs especially since there is a plethora of clubs around Orange County. Furthermore, in Orange County there are a lot of clubs that are intended for the homosexual community. Also, since most of them have a lot of pride they probably will not admit to the fact that they can also get HIV, so they probably do not do get tested for the disease.
Another comparison that was made was evaluating the number of people living per household. Doing this correlation it became clear that households that hold one, three, four and seven people were the ones that had a strong correlation with the AIDS rate. The houses that held only one person or seven people were the ones that had a positive correlation; on the other hand, when there were three or four people living together they tended to have a negative correlation (Set Graph 2. and Table 2.)
Table 2
|
Households |
||||
|
|
1 |
3 |
4 |
7 |
|
Correlation |
0.306 |
-0.725 |
-0.653 |
0.474 |


The one person per household data (blue diamonds) there is once again an outlier. If this outlier, Santa Ana would be removed, there would be a positive correlation of 0.52. This shows that the more people chose to live by themselves; they run a higher risk of obtaining AIDS. However, Santa Ana has the highest percentage of seven people living together and yet it is still positively correlated. The reasons why this is probably occurring is that many homosexual men go to the clubs and return to their homes with strangers. Since there is nobody else living in that house, it could be easier for them to bring back strangers without the possibility of being asked with questions, or having problems with their roommates. Another reason could be that it also shows the extent of their wealth; if they only have to sustain themselves then they can spend the rest of their earnings by going to clubs. However, the households that lodges seven people or more also had a high correlation, the reason for this is probably because the house is extremely crowded with people all the time and so it is easier for the disease to spread around. Especially in Santa Ana, there are many homes where families of seven or more live together and usually it is due to having a really high number of illegal immigrants, who usually reside with relatives.
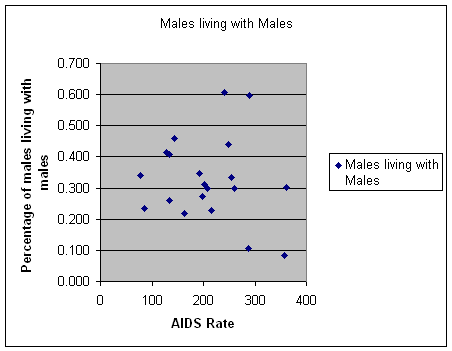
Another comparison was to discover if there was a direct correlation between males who are living with males and AIDS rates. However, there was absolutely no significant correlation between these two (Table 3 and Graph 3). One would speculate that males living together would most likely be homosexual especially since the main mode of transmission in Orange County is 78% out of the total AIDS cases. Since Orange County has such a high percentage of people being homosexual, one would assume that males living together would have something to do with how many people are getting AIDS.
Table 3.
|
Rate of male householder and male partner |
||
|
||
|
Graph 3 |

A probable reason for such a wide range of data is that the roommates are heterosexual, or they are homosexual, but in monogamous relationships. Thus, they probably do not attend the bathhouses or clubs where they could contract the disease.
In conclusion, it is apparent that there are no obvious connections between the amount of AIDS cases that have occurred and situations that people are living in. There are some that do relate like the amount of income families are making, but overall it is impossible to pin point the cause because one can never know if there is a third variable. Perhaps it really has to do with the number of people living together in one house, or the amount of money families make, or not acquiring an adequate education. These correlations will never be one hundred percent accurate and who knows maybe the reason that people are getting AIDS is right in front of our faces, but we just have not been able to see it yet. The reasons on how people are contracting this fatal disease might not be clear, but what is clear is that we need an immediate solution to cease the spread of the virus.