![]()
![]()
![]()
![]()
![]()
![]()

Riley Croghan |
The AIDS Epidemic in Washington, DC Statistics |
STATISTICS
CONTENTS
Map One:...............................................................................The
Eight Wards At A Glance
Table One:...................................................Cumulative
& Living AIDS Cases by Ward
Table Two:.........................................................................................Racial
Profile by Ward
Table Three:...........................................%Black vs. Cumulative AIDS cases, by Ward
Table Four:..........................................AIDS Cases by Mode of Transmission in D.C.
Table Five:..................MALE AIDS Cases by Mode of Transmission/Race in D.C.
Map Two:.........................................................................................MSM total cases in D.C.
Map Three:..................................................................................Female/Male Ratio in D.C
Map Four:.............................................Transmission from IDU/Sex/Childbirth in D.C.
Table Six:............................Public Assistance vs. Cumulative AIDS cases, by Ward
Table Seven:........%Births to Teen Mothers vs. Cumulative AIDS cases, by Ward
Table Eight:..............................Family Income vs. Cumulative AIDS cases, by Ward
Table Eight:..............................Violent Crimes vs. Cumulative AIDS cases, by Ward
http://upload.wikimedia.org/wikipedia/en/c/cb/2002_dc_ward_map.jpg
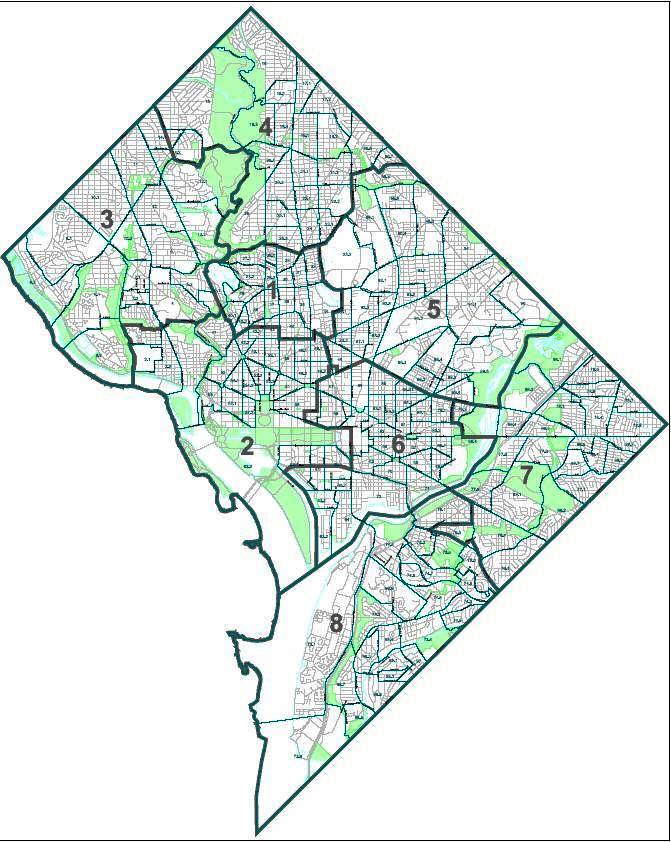
Map One: The Eight Wards At A Glance
Table One: Cumulative and Living AIDS Cases by Ward, 2003*
| Ward | Total Population | Cumulative Diagnosed AIDS | Living AIDS | Rate of Living AIDS per 100,000 | Rate of Cumulative AIDS per 100,000 |
| 1 | 73,364 | 2,482 | 1,361 | 1,855 | 3,383 |
| 2 | 68,869 | 2,308 | 1,195 | 1,735 | 3,351 |
| 3 | 73,718 | 477 | 189 | 256 | 647 |
| 4 | 74,092 | 1,337 | 786 | 1,061 | 1,805 |
| 5 | 72,527 | 1,727 | 1,007 | 1,475 | 2,381 |
| 6 | 68,035 | 2,023 | 1,088 | 1,599 | 2,973 |
| 7 | 70,540 | 1,182 | 726 | 1,029 | 1,676 |
| 8 | 70,914 | 1,303 | 809 | 1,141 | 1,837 |
| OTHER | 1,170 | 933 | |||
| TOTAL | 572,059 | 11,441 | 8,094 |
Ward 3 has a shockingly low number of recorded HIV infections, both cumulative and diagnosed. Ward 3 has less than half the cumulative cases as the next lowest ward (7), and not even one fifth the cases of the highest ward (1). With living AIDS cases, the next lowest ward has 10 times the infections.
*Information from "The HIV/AIDS Epidemiologic Profile for the
District of Columbia" Dec 2004
[4]
Table Two: Racial Profile by Ward, 2000*
Ward three is again radically different. Whites dominate the population. In most other Wards, the white population is less than 50%. Might race and AIDS rates be correlated?
*Table copied from "The HIV/AIDS Epidemiologic Profile for the District of Columbia" Dec 2004 [4]
Table Three: Percent Black vs. Cumulative AIDS rate
| WARD | PERCENT BLACK* | CUMULATIVE AIDS RATE |
| 1 | 46 | 3,383 |
| 2 | 20 | 3,351 |
| 3 | 6.2 | 647 |
| 4 | 79 | 1,805 |
| 5 | 86 | 2,381 |
| 6 | 65 | 2,973 |
| 7 | 97 | 1,676 |
| 8 | 93 | 1,837 |
Correlation: .0442
Correlation without Ward 3: .89
After excluding Ward 3, this is the strongest correlation I found. It also shows the most dramatic effect of removing Ward 3.
*Information from "The HIV/AIDS Epidemiologic Profile for the District of Columbia" Dec 2004 [4]
Table Four: AIDS Cases by Mode of Transmission in Washington, D.C.****
|
Mode of Transmission |
Male |
Female |
Total |
Percent |
|
MSM* |
7110 |
0 |
7110 |
42.83% |
|
IDU** |
2519 |
1352 |
3871 |
23.30% |
|
MSM/IDU |
665 |
0 |
665 |
4% |
|
Het. Sex w/IDU |
289 |
322 |
611 |
3.70% |
|
Het. Sex w/PWHA*** |
556 |
765 |
1321 |
8% |
|
Het. Sex w/Recipients Blood Prod. |
11 |
8 |
19 |
0.10% |
|
Het/ Sex w/Bi Male |
0 |
42 |
42 |
0.20% |
|
Het. Total |
856 |
1137 |
1993 |
12% |
|
Blood/Blood Products |
65 |
52 |
117 |
0.70% |
|
No Identified Risk |
561 |
289 |
850 |
5.10% |
|
Total |
12632 |
3967 |
16599 |
100% |
*MSM = Men who had Sex with Men
**IDU= Intravenous Drug User
***PWHA=Person Who Has AIDS
****Information from "The HIV/AIDS Epidemiologic Profile for the District of
Columbia" Dec 2004
[4]
Table Five: MALE AIDS Cases by
Mode of Transmission/Race in Washington DC
*Table copied from "The HIV/AIDS Epidemiologic Profile for the District of Columbia" Dec 2004 [4]
Map Two:
The Wards affected most by MSM are 1, 2, and 3. Ward 3 seems exceptionally high, but it really only accounts for a very small amount of the cases in D.C. as a whole. Amazingly, even though Wards 1 and 2 are part of the "gay neighborhood", only a little over half of the AIDS cases are from MSM. See Map Four for more.
*Map from "The HIV/AIDS Epidemiologic Profile for the District of Columbia" Dec 2004 [4]
Map Three:
This map shows the very substantial female population in Ward 3. In all of D.C., 42% of AIDS cases are reportedly transmitted between males only (Table Four). A higher female population automatically limits how many cases can be caused between men. Interestingly, something similar seems to be at work in wards 1 and 2.
*Map from "The HIV/AIDS Epidemiologic Profile for the District of Columbia" Dec 2004 [4]
Map Four:
Almost the opposite of Map Two, this map shows the other major risks for transmission of AIDS. Amazingly, Wards 1 and 2 are not very affected. So what is causing the huge number of AIDS cases in those areas?
*Table copied from "The HIV/AIDS Epidemiologic Profile for the District of Columbia" Dec 2004 [4]
Table Six: Public Assistance vs. AIDS*
| WARD | % Households on Public Assistance | CUMULATIVE AIDS RATE |
| 1 | 4.9 | 3,383 |
| 2 | 1.6 | 3,351 |
| 3 | 0.4 | 647 |
| 4 | 3.4 | 1,805 |
| 5 | 6.7 | 2,381 |
| 6 | 5.1 | 2,973 |
| 7 | 9.4 | 1,676 |
| 8 | 16 | 1,837 |
Correlation: .0789 (Very Weak)
Correlation without Ward 3: .598 (stronger, not quite significant)
*Information from neighborhoodinfodc.org, Neighborhood Info In D.C., from the 2000 Census [8]
Table Seven: Teen Mothers vs. AIDS*
| WARD | % BIRTHS TO TEEN MOTHERS | CUMULATIVE AIDS RATE |
| 1 | 12 | 3,383 |
| 2 | 9.4 | 3,351 |
| 3 | 0.8 | 647 |
| 4 | 11 | 1,805 |
| 5 | 18 | 2,381 |
| 6 | 14 | 2,973 |
| 7 | 20 | 1,676 |
| 8 | 20 | 1,837 |
Correlation: .229 (Weak)
Correlation without Ward 3: .65 (Stronger, not quite significant)
*Information from neighborhoodinfodc.org, Neighborhood Info In D.C., from the 2000 Census [8]
Table Eight: Family Income vs. AIDS* 1999
| WARD | Avg. Family Income | CUMULATIVE AIDS RATE |
| 1 | 59,140 | 3,383 |
| 2 | 130,891 | 3,351 |
| 3 | 187,709 | 647 |
| 4 | 81,500 | 1,805 |
| 5 | 54,479 | 2,381 |
| 6 | 67,454 | 2,973 |
| 7 | 45,039 | 1,676 |
| 8 | 35,228 | 1,837 |
Correlation: .336
Correlation without Ward 3: .55
*Information from neighborhoodinfodc.org, Neighborhood Info In D.C., from the 2000 Census [8]
Table Nine: Violent Crimes vs. AIDS*
| WARD | Violent Crimes | CUMULATIVE AIDS RATE |
| 1 | 17 | 3,383 |
| 2 | 14 | 3,351 |
| 3 | 2.4 | 673 |
| 4 | 11 | 1,805 |
| 5 | 17 | 2,381 |
| 6 | 20 | 2,973 |
| 7 | 17 | 1,676 |
| 8 | 20 | 1,837 |
Correlation: .611
without Ward 3: .07
*Information from neighborhoodinfodc.org, Neighborhood Info In D.C., from the 2000 Census [8]