| Table 5 | ||
| Correlation Coefficient | P Value | |
| % Population with Private Vehicle Occup (Car, truck, or van) | -0.771224 | > .01 |
Plot 7
|
Plot 7 |
||||||||||
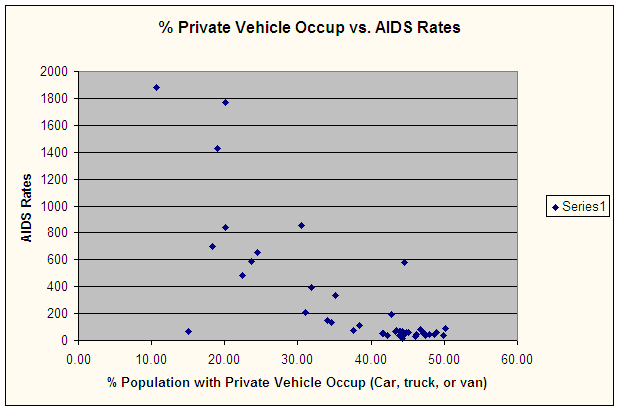
| The final variables which I attempted to correlate were percent of the population that occupies a private vehicle, defined as a car, truck, or van, and AIDS rates, which calculated to be -0.77 (Table 5). In light of the negative correlation between median household income and AIDS rates and the positive correlation between percentage of the population receiving public assistance and percentage below the poverty line and rates per 100,000, a negative correlation between private vehicle occupancy and AIDS rates is logical; zipcodes in which a large percent of the population possesses private vehicles represent the wealthier areas where AIDS rates are small. The more likely people are to own a vehicle, the wealthier they are; the wealthier a person is, the greater the chance that they reside in an area with decreased AIDS rates. In zipcode 14202, only about 19% of people own private vehicles; the median income is $24,000, which represents the lower half of the spectrum. Similarly, in 14203, only 10.70% of the population owns a private vehicle, correlating with the high AIDS rate of 1883 and low median household income of $9400 (Table 3, 5, Scatterplot 7). The scatterplot for private vehicle occupancy resembles the scatterplot for median household income, reflecting the fact that the populations in which an increased percentage of the population owns vehicles are concentrated within wealthier areas, which possess the lowest AIDS rates. | |||||||||||