| Table 4 | ||
| Correlation Coefficient | P Value | |
| % Households with Pub Assist | 0.770209 | <.01 |
| % Households below Pov Lev | 0.753251 | <.01 |
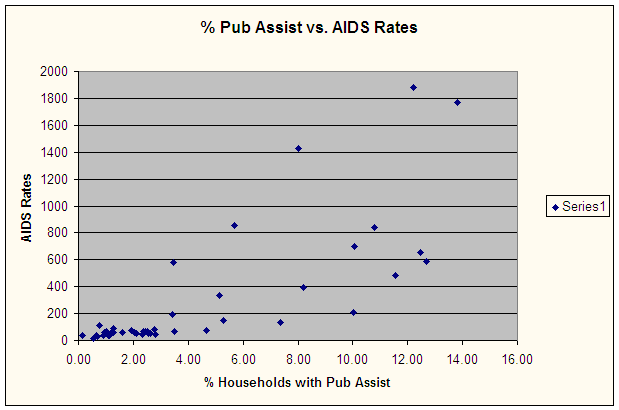 Plot 5
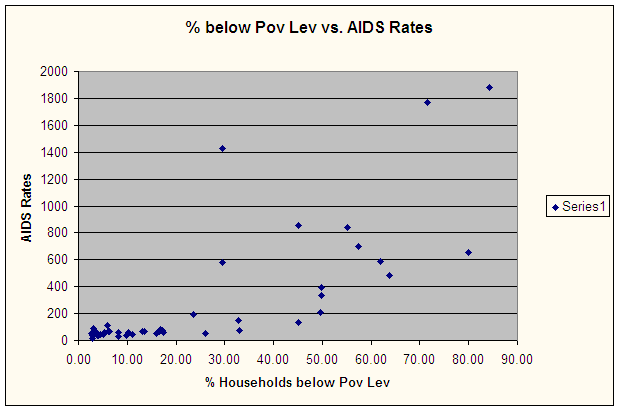 Plot 6
The negative correlation between median household and income and AIDS rates is also linked to the positive correlations between percentage of households with public assistance and AIDS rates and percentage of households below the poverty level and rates. Zipcodes with the lowest median household income have the greatest percentage of households with public assistance and those that are below the poverty level. The correlation coefficient for percentage of households receiving public assistance is 0.77, which is greater than the .01 confidence level. Similarly, the coefficient for percentage of households below the poverty level is 0.75, also exceeding the .01 confidence level (Table 4). Zipcodes with the highest AIDS rates possess both the largest percentage of households both receiving public assistance and below the poverty level. In 14203, which has the highest AIDS rate in Erie County, 1883, 12% of the population obtains public assistance and 84.24% of the population is below the poverty level. 14203 also has the lowest median household income in Erie County, $9,400, which is about 1/6th of the highest income. Revealing a similar plight, in 14213, which has a rate about 2 times that of the national average, 12.46% of the population receives public assistance and about 80% is below the poverty level (Table 3, 4, Scatterplots 5,6). Like the Scatterplots for race, Scatterplots 5 and 6 for percentage of Public Assistance and percentage below the poverty line reveal clusters for AIDS rates of 100 or less; all of these areas possess the lowest percentage of the population that receive public assistance or are below the poverty line.