|
The
positive correlations between percentage of the population that is
Hispanic and black and AIDS rates helps to reveal the strong negative
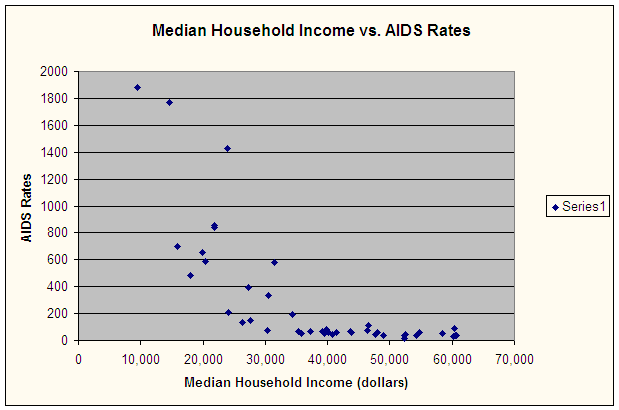
correlation between median household income and AIDS rates, which
demonstrated a correlation coefficient of -0.72, which is greater than
the.01 confidence level (Table 3). The negative correlation of median
household income established a three-way link between race, AIDS rates,
and income; areas with greater minority population have lower household
incomes and increased AIDS rates. Not only do AIDS rates correlate with
percent of the population that is Hispanic, but Hispanic portion of the
total population correlates with low median household income. Zipcodes
such as 14201 and 14213, which possess the highest Hispanic percentage
of the population out of all the zipcodes in Erie County, 36.37% and
27.61%, also possess a low median household income. The income of
14201, $14,642, and 14213, $19,934, are the second and fourth lowest
median incomes in Erie County. The converse also proves true, as
perceived in the fact that the zipcode with the highest median household
income, 14031, with an income of $60,694, has a population that is
97.38% white and only 0.42% black; the AIDS rate is 34, about 1/10th
that of the national rate. Similarly, 14221, which has the second
highest income for Erie County, has a population that is 92.10% white
and 2.09% black; the AIDS rate for this area is 37 despite the fact that
it has the largest total population for all of the zipcodes in Erie
County (Table 2, 3). Both of these areas represent wealthy suburbs that
are the most desired locations for residential development. The median
household incomes for Erie County reveal a great dichotomy of wealth;
there are many more areas with higher incomes. The wealthiest zipcodes,
20 out 44, have an income ranging from $40,000 to $60,000, while 8
zipcodes have incomes ½ to 1/3 less than the wealthiest areas (Table
3, Scatterplot 4). As seen in Scatterplot 4, zipcodes with the
lowest AIDS rates possess incomes within the $40,000 to $60,000 range.
|
 Plot
4
Plot
4