| Table 2 | ||
| % Race | Correlation Coefficient | P Value |
| % Hispanic | 0.567144 | >.01 |
| % Black | 0.657494 | >.01 |
| % White | -0.758622 | >.01 |
 Plot 1
 Plot 2
 Plot 3
|
Plot 1 |
|||||||||||||||
| Plot 2 |
Plot 3 |
|
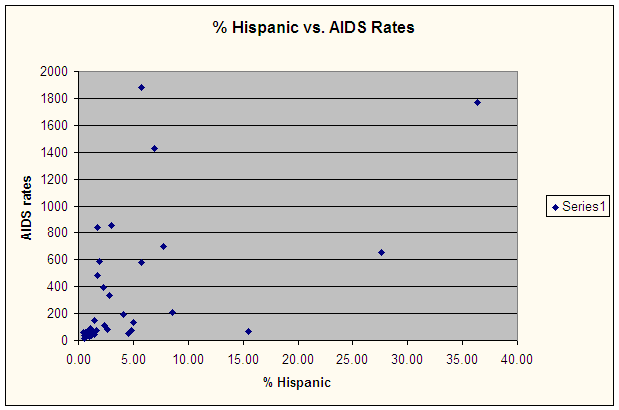
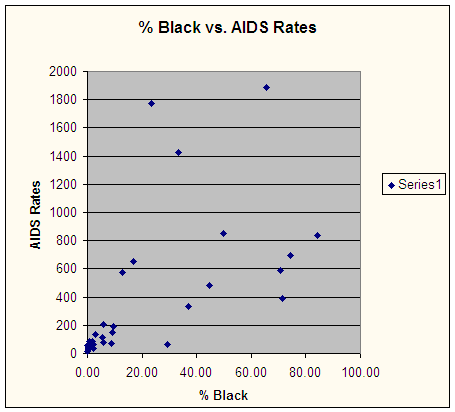
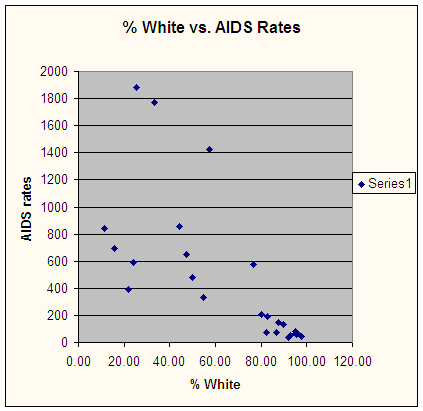
Due to my belief in prevalence of AIDS among blacks, the first correlation I tried was between % black population and AIDS rates. The correlation coefficient calculated to about 0.657, which is greater than the .01 confidence level (Table 2). Zipcodes with the largest percentage of black populations, 14208 with 84.24% and 14204 with 74.24% possess AIDS rates at the high end of the spectrum, 840 cases per 100,000 for 14208 and 697 cases for 14204. In the zipcode in Erie County with the highest AIDS rate, 14203, blacks comprise 65.61% of the population (Table 1, 2; Scatterplot 2). In addition to correlating the percentage of population that is black for the zipcodes in Erie County, I also correlated the percentage of Hispanic population. The correlation coefficient between AIDS rates and % of the population that is Hispanic is approximately 0.567, which is greater than the .01 confidence level (Table 2). Much like the zipcodes with high AIDS rates possess a large black population, zipcodes with increased rates also constitute a great Hispanic population; about 1/3 to ¼ of the population in these areas is Hispanic. For example, the population of zipcode 14201 is 36.37% Hispanic, and the area has an AIDS rate of 1770. Similarly, 14213, whose rate of 652 is about 2 times that of the national rate, exhibits a 27.61% Hispanic population. Zipcodes with the lowest AIDS rates, including 14001, 14031, 14224, and 14225, all have populations in which less than 1% is Hispanic. 14001 has a rate of 43, about 1/8th that of the national average, and has a population that is 0.60% Hispanic. Similarly, the population of 14224, which has a rate of 44, is 0.82% Hispanic (Table 1, 2, Scatterplot 1). The positive correlations between AIDS rates and percent of the population that is black and Hispanic elucidate the strong negative correlation between rates and white percentage of the population. The correlation coefficient of -0.76 represents a value greater than the .01 confidence level (Table 2). Zipcodes in which the population is 90% or greater white have the lowest AIDS rates. 14001, whose population is 97.58% white, possesses an AIDS rate of 43; similarly, 14052, which has the lowest AIDS rate in Erie County, 16, despite the fact that its population of 18,248 is 2 times the size of areas including 14204, which has a rate of 697, and 14209, whose rate is 854, is 98.42% white. Zipcodes with populations dominated by minorities exhibit the highest AIDS rates, as perceived in the fact that the population of 14204, whose black population, 74.24% is 5 times greater than the white population, 15.78%, possesses the highest AIDS rate in Erie County. Zipcodes in which the population is less than 80% white have the highest AIDS rates. For example, although the population of 14222 is about ¾ white, or 76.47%, its rate is 578, demonstrating the correlation between AIDS rate and percentage of the population that is black, in this case 12.96%. The population of 14201 is relatively evenly distributed among Hispanics, who constitute 36.37% of the population, whites, 33.25%, and blacks, 23.42%; this zipcode has the second highest AIDS rate in Erie County. Similarly, 14212 possesses an equally distributed population among whites, who comprise 49.95% of the population, and blacks, 44.64%; the rate of the area, 481, exceeds the national average (Table 1, 2, Scatterplot 3). Scatterplots 1,2, and 3 all possess clusters in regard to zipcodes in which the AIDS rates are around 100 or less; these zipcodes with decreased AIDS rates all possess small Hispanic and black populations, as perceived in Scatterplots 1 and 2, and large white populations, as perceived in Scatterplot 3.
|