| Quick Links |
AIDS in Indiana County Project Two: Correlations
|
||||||||||||||||||||||||||||||||||||||||||||||||||||||||||||||||||||||||||||||||||||||||||||||||||||||||||||||||||||||||||||||||||||||||||||||||||||||||||||||||||||||||||||||||||||||
|
Race Correlations |
|||||||||||||||||||||||||||||||||||||||||||||||||||||||||||||||||||||||||||||||||||||||||||||||||||||||||||||||||||||||||||||||||||||||||||||||||||||||||||||||||||||||||||||||||||||||
|
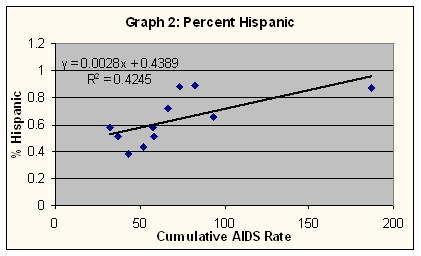
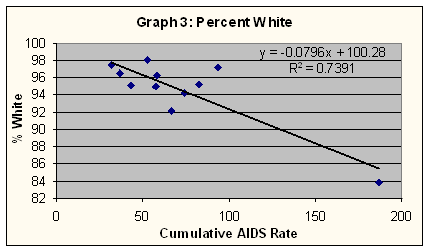
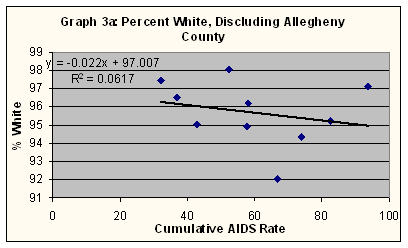
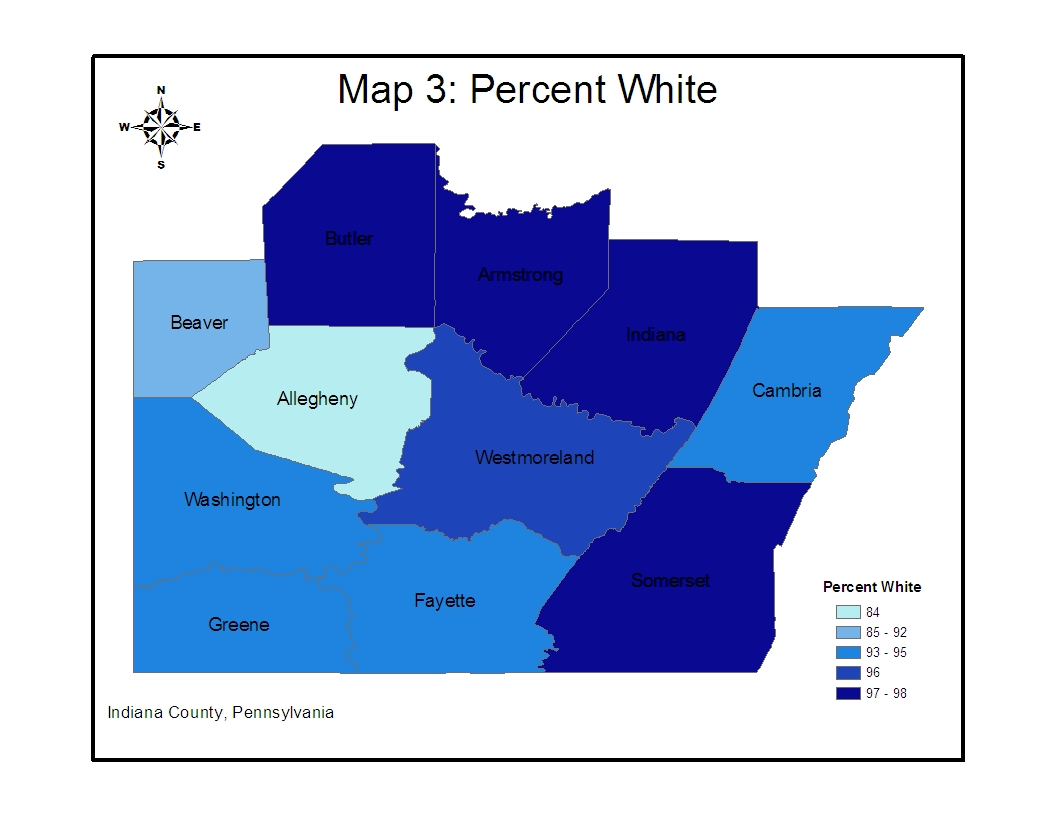
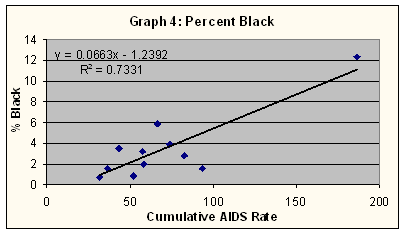
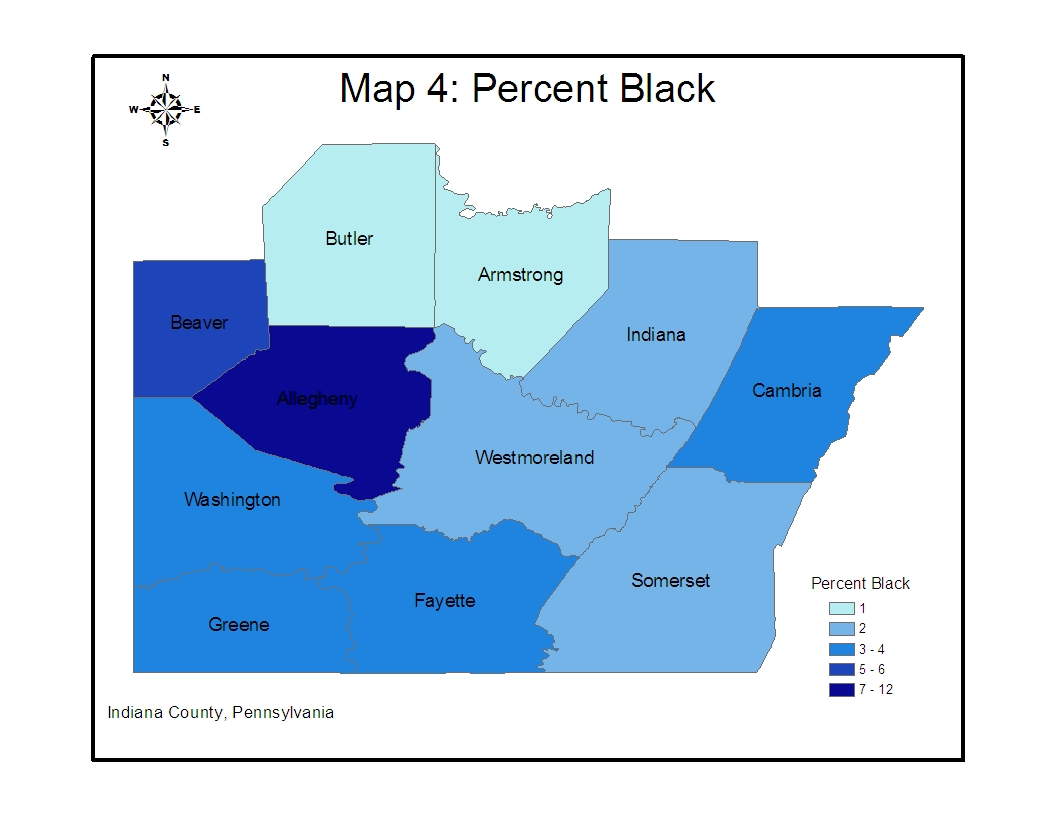
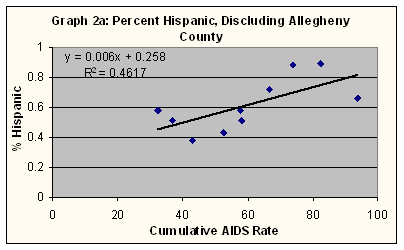
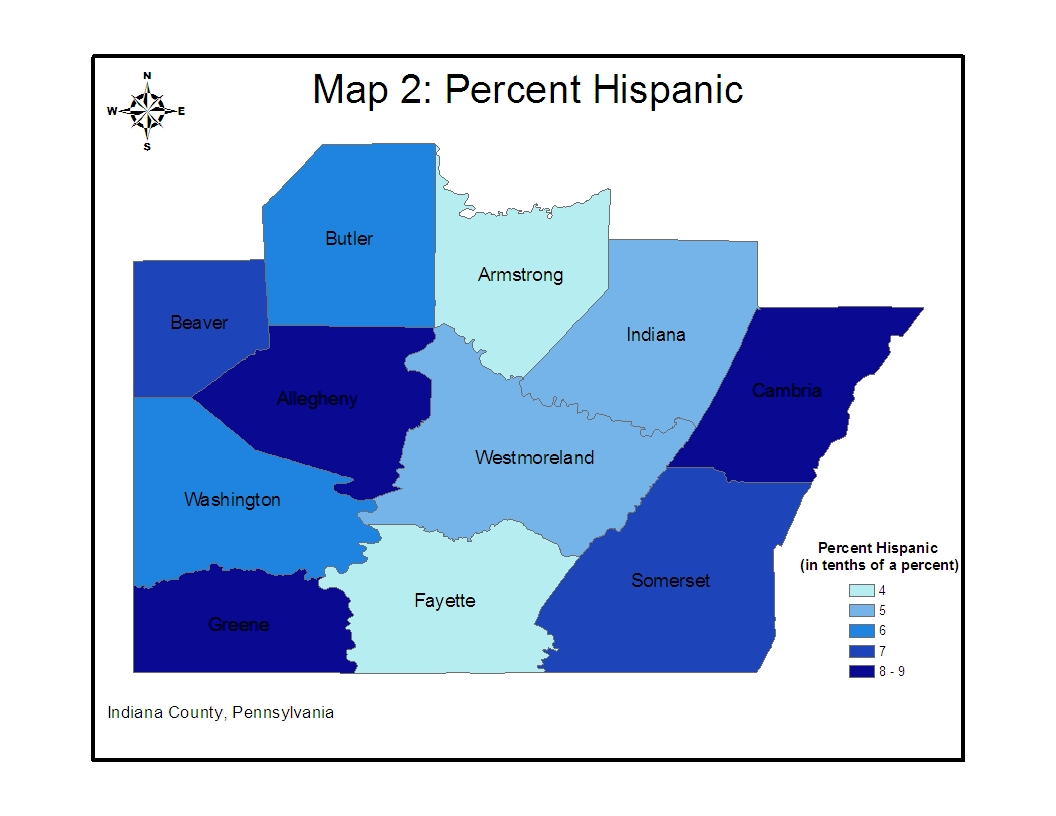
I also investigated the correlation of race to AIDS rates. I figured that for the United States there would be a very strong, positive correlation for the percentage of black or African Americans in the population, but was not sure what to expect for my counties. The only area where there is a remotely significant percentage of African Americans is in Allegheny County, most likely due to the metropolitan area in and around Pittsburgh (Table 3; Map 4).[2] Therefore, I did not expect to see a strong correlation for the percentage of black persons in the rest of Southwestern Pennsylvania. After compiling census data on race, I found significant correlation coefficients for percentages of white, black, and Hispanic populations. The strong positive correlations for the black percent of the population, and even stronger negative correlation for the white percent are congruous with my predictions (Table 6). Once again, Allegheny County was an outlier, and once removed, no significant correlations existed regarding either race (Graph 3; Graph 3a; Graph 4; Graph 4a). I was most surprised by the significantly positive correlation to the percentage of Hispanics, especially that the correlation actually grew stronger after removing the outlying Allegheny County (Graph 2; Graph 2a). The correlation between the Hispanic percent of the population and the AIDS rate is the only correlation, of all the data sets I worked with, that displayed significance after removing Allegheny County. However, after examining the graphical data, I realized that the data did not truly produce a meaningful correlation value; instead of being closely related in a linear fashion, the data points merely deviate from the linear regression line in virtually equal magnitude on either side of the line (Graph 2a). (See also Map 2; Map 3.)
|
|||||||||||||||||||||||||||||||||||||||||||||||||||||||||||||||||||||||||||||||||||||||||||||||||||||||||||||||||||||||||||||||||||||||||||||||||||||||||||||||||||||||||||||||||||||||
|
Table 3: Adult/Adolescent AIDS**: Race/Ethnicity by Gender
* Breakdown of data in Indiana County is from 2004, when there were 31 cases. 2005 statistics record 33 cumulative cases of AIDS ** Does not include pediatric (<13) AIDS cases ** Southwestern PA represents data collected from the Southwest Pennsylvania AIDS Planning Coalition, encompassing Allegheny, Armstrong, Beaver, Butler, Cambria, Fayette, Greene, Indiana, Somerset, Washington, and Westmoreland Counties. |
|||||||||||||||||||||||||||||||||||||||||||||||||||||||||||||||||||||||||||||||||||||||||||||||||||||||||||||||||||||||||||||||||||||||||||||||||||||||||||||||||||||||||||||||||||||||
| Table 6: Correlations with Race
|
|||||||||||||||||||||||||||||||||||||||||||||||||||||||||||||||||||||||||||||||||||||||||||||||||||||||||||||||||||||||||||||||||||||||||||||||||||||||||||||||||||||||||||||||||||||||
 |
 |
||||||||||||||||||||||||||||||||||||||||||||||||||||||||||||||||||||||||||||||||||||||||||||||||||||||||||||||||||||||||||||||||||||||||||||||||||||||||||||||||||||||||||||||||||||||
 |
|||||||||||||||||||||||||||||||||||||||||||||||||||||||||||||||||||||||||||||||||||||||||||||||||||||||||||||||||||||||||||||||||||||||||||||||||||||||||||||||||||||||||||||||||||||||
|
|
|
 |
|||||||||||||||||||||||||||||||||||||||||||||||||||||||||||||||||||||||||||||||||||||||||||||||||||||||||||||||||||||||||||||||||||||||||||||||||||||||||||||||||||||||||||||||||||||
 |
|||||||||||||||||||||||||||||||||||||||||||||||||||||||||||||||||||||||||||||||||||||||||||||||||||||||||||||||||||||||||||||||||||||||||||||||||||||||||||||||||||||||||||||||||||||||
| back | |||||||||||||||||||||||||||||||||||||||||||||||||||||||||||||||||||||||||||||||||||||||||||||||||||||||||||||||||||||||||||||||||||||||||||||||||||||||||||||||||||||||||||||||||||||||