|
Since male-to-male
sexual contact was the most common mode of transmission for AIDS
cases in Indiana County, Southwestern Pennsylvania, and
Pennsylvania, I expected that there would be a positive correlation
between the AIDS rate and households comprised of two male partners
living together12.
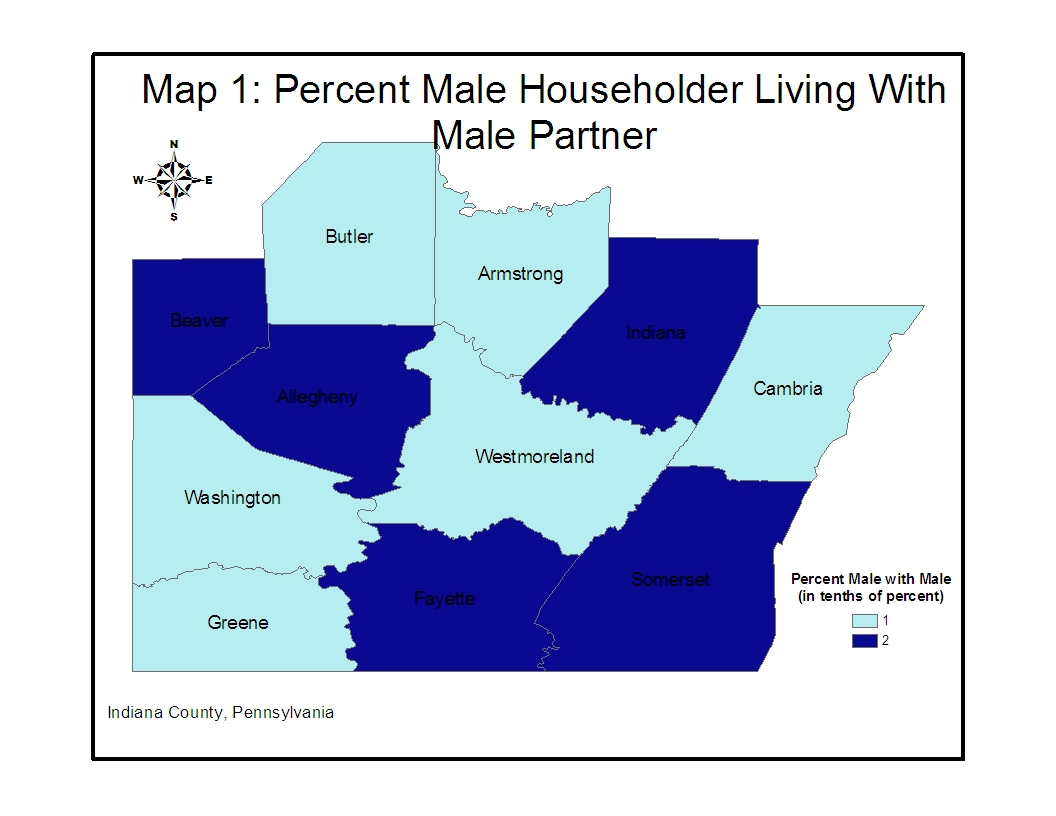
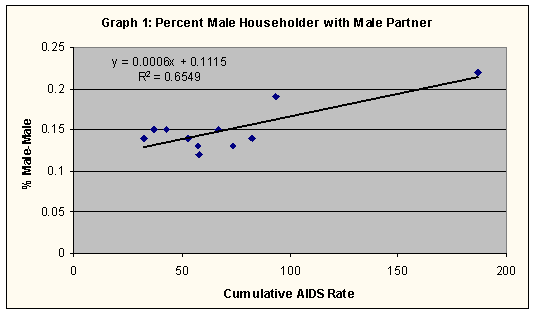
I gathered census data on unmarried-partner households and found
that there was a strong, positive correlation between the
percentages of male householders living with a male partner and the
AIDS rates for the counties in Southwestern Pennsylvania
(Table 4; Table 5;
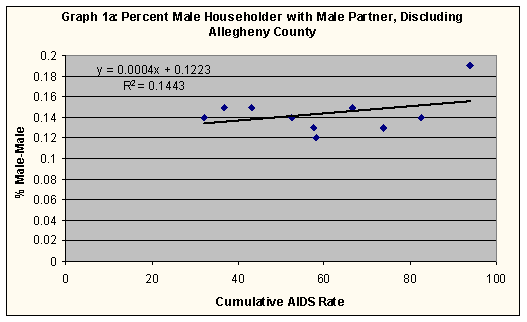
Map 1). When I graphed this data, I noticed
a cluster of points with an outlier, Allegheny County (Graph
1). After removing Allegheny County from consideration, the
correlation coefficient for the male-partner households decreased
greatly, showing that there was no significance in the correlation
for the remaining ten counties (Graph 1a). |
Table 4:
Cumulative AIDS Cases: Mode of Transmission by Gender
|
|
MSM |
IDU |
MSM/IDU |
HCD |
HRH |
BT |
Other |
Total Adult** |
Pediatric |
|
Male |
Indiana County |
|
|
|
|
|
|
|
|
|
|
SW PA |
|
|
|
|
|
|
|
2,822*** |
|
|
PA |
|
|
|
|
|
|
|
24,287 |
199 |
|
USA |
416,232 (54%) |
159,676(21%) |
62,940
(8%) |
5,142
(1%) |
46,533 (6%) |
5,190 (1%) |
69,095 (9%) |
764,808 |
|
|
Female |
Indiana County |
|
|
|
|
|
|
|
|
|
|
SW PA |
|
|
|
|
|
|
|
446*** |
|
|
PA |
|
|
|
|
|
|
|
6,325 |
151 |
|
USA |
--- |
65,534 (36%) |
--- |
340 (0%) |
79,872 (44%) |
4,144 (2%) |
31,879 (18%) |
181,769 |
|
|
Total |
Indiana County* |
20 (65%) |
2 (6%) |
1 (3%) |
1 (3%) |
3 (10%) |
1 (3%) |
3 (10%) |
31 |
0 |
|
SW PA |
1,934 (59%) |
565 (17%) |
179 (5%) |
57 (2%) |
331 (10%) |
55 (2%) |
126 (4%) |
3,248 |
20 |
|
PA |
12,107 (40%) |
10,138 (33%) |
1,585 (5%) |
243 (1%) |
5,160 (17%) |
274 (1%) |
1,079 (3%) |
30,586 |
376^ |
|
USA |
416,232
(44%) |
225,210 (24%) |
62,940 (7%) |
5,482 (0%) |
126,405 (13%) |
9,334 (1%) |
100,975 (11%) |
946,578 |
9,441 |
* Breakdown of data in Indiana County is from 2004, when there
were 31 cases. 2005 statistics record 33 cumulative cases of
AIDS
** Percentages of modes of transmission are based on the total
adult population, and do not take into account pediatric cases
*** Includes 20 pediatric cases with an unknown distribution
between male and female
^ Includes 26 adult cases suspected to have occurred before 13
MSM: Male-to-male sexual contact
IDU: Injection drug use
MSM/IDU: Male-to-male sexual contact and injection drug use
HCD: Hemophilia/coagulation disorder
HRH: High-risk heterosexual contact
BT: Receipt of blood transfusion, blood components, or tissue |
|
Table 5: Correlations
with Household Type
|
County |
Total
Population |
Cum
AIDS
Cases |
Cum
AIDS
Rate |
Total
households: |
Unmarried-
partner
households: |
%
Unmarried |
Male
householder
and male
partner |
%
Male-
Male |
Male
householder
and female
partner |
%
Male-
Female |
Female
householder
and female
partner |
%
Female-
Female |
Female
householder
and male
partner |
%
Female-
Male |
All other
households |
%Other
Households |
|
Allegheny |
1,281,666 |
2,393 |
186.71 |
537,150 |
23,371 |
4.35 |
1,155 |
0.22 |
10,353 |
1.93 |
1,242 |
0.23 |
10,621 |
1.98 |
513,779 |
95.65 |
|
Armstrong |
72,392 |
38 |
52.49 |
29,005 |
1,304 |
4.5 |
41 |
0.14 |
729 |
2.51 |
53 |
0.18 |
481 |
1.66 |
27,701 |
95.5 |
|
Beaver |
181,412 |
121 |
66.7 |
72,576 |
3,021 |
4.16 |
109 |
0.15 |
1,519 |
2.09 |
114 |
0.16 |
1,279 |
1.76 |
69,555 |
95.84 |
|
Butler |
174,083 |
56 |
32.17 |
65,862 |
2,763 |
4.2 |
91 |
0.14 |
1,562 |
2.37 |
111 |
0.17 |
999 |
1.52 |
63,099 |
95.8 |
|
Cambria |
152,598 |
126 |
82.57 |
60,531 |
2,413 |
3.99 |
85 |
0.14 |
1,300 |
2.15 |
91 |
0.15 |
937 |
1.55 |
58,118 |
96.01 |
|
Fayette |
148,644 |
64 |
43.06 |
59,969 |
2,893 |
4.82 |
87 |
0.15 |
1,457 |
2.43 |
132 |
0.22 |
1,217 |
2.03 |
57,076 |
95.18 |
|
Greene |
40,672 |
30 |
73.76 |
15,060 |
744 |
4.94 |
19 |
0.13 |
403 |
2.68 |
28 |
0.19 |
294 |
1.95 |
14,316 |
95.06 |
|
Indiana |
89,605 |
33 |
36.83 |
34,123 |
1,338 |
3.92 |
52 |
0.15 |
772 |
2.26 |
50 |
0.15 |
464 |
1.36 |
32,785 |
96.08 |
|
Somerset |
80,023 |
75 |
93.72 |
31,222 |
1,267 |
4.06 |
58 |
0.19 |
704 |
2.25 |
54 |
0.17 |
451 |
1.44 |
29,955 |
95.94 |
|
Washington |
202,897 |
117 |
57.66 |
81,130 |
3,468 |
4.27 |
104 |
0.13 |
1,845 |
2.27 |
144 |
0.18 |
1,375 |
1.69 |
77,662 |
95.73 |
|
Westmoreland |
369,993 |
215 |
58.11 |
149,813 |
5,590 |
3.73 |
185 |
0.12 |
2,983 |
1.99 |
219 |
0.15 |
2,203 |
1.47 |
144,223 |
96.27 |
|
|
|
|
|
|
|
|
|
|
|
|
|
|
|
|
|
|
|
Correlations |
|
|
|
|
|
0.0355 |
|
0.809 |
|
-0.503 |
|
0.518 |
|
0.389 |
|
|
|
Correlations
w/out Allegheny County |
|
|
|
|
|
0.380 |
|
|
|
|
|
|
|
|
|