RACE
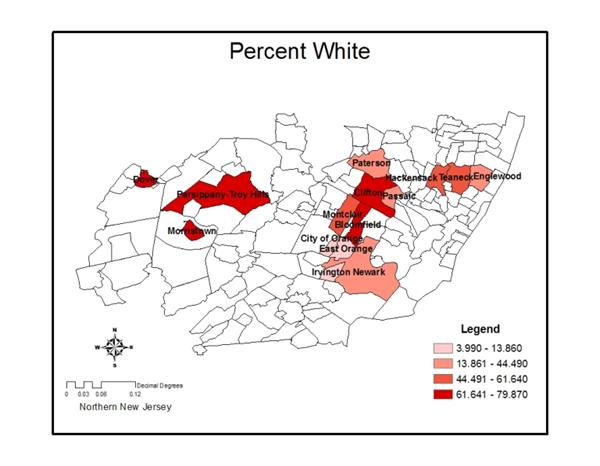
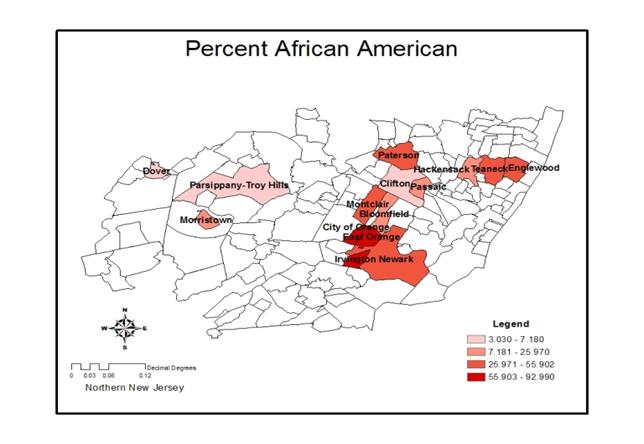
When examining the fifteen cities it was clear that some were predominantly white while others predominantly African American. Because the HIV/AIDS rate for African Americans in New Jersey is so high, 3,533 per 100,00 people, and the rate that of the white population is only 300 per 100,000 people, I correlated the percentage of African Americans and whites in a city to the AIDS rate of that city.
New Jersey (HIV/AIDS) (1,7):
|
|
Cases |
Total Population of the race |
AIDS rate per 100,000 |
|
Hispanic, All Races |
13,050 |
1,117,191 |
1168 |
|
Non Hispanic, Black, or African American |
38,734 |
1,096,171 |
3533 |
|
Non Hispanic, White |
16,667 |
5,557,209 |
300 |
Not surprisingly, there was a strong negative correlation between the percent of the population in the city that was white, -0.827, and a strong positive correlation between the percent of the population that was African American, 0.819. The cities of Irvington and East Orange both had a significantly lower percent white population, 9.37% and 3.99% respectively, while having higher percent black populations, 85.28% and 92.99% respectively. Both of these cities had extremely high cumulative AIDS rates per 100,000 people, those of 3,070 and 2,059 respectively. As urban centers of Essex County, New Jersey, Irvington and East Orange tend to have higher populations of African Americans as opposed to the more suburban areas of Clifton and Parsippany.
|
|
|
|