Tables and Statistics

Back to Background


New York State Department of Health: Bureau of HIV/AIDS Epidemiology


Text Box: Zip Code
Cumulitive AIDS
Population
Cumulitive AIDS rate
10451
1395
40,961
3405.69
10452
2176
72,138
3016.44
10453
2007
76,775
2614.13
10454
1404
34,976
4014.18
10455
1157
37,465
3088.22
10456
3231
76,656
4214.93
10457
2790
69,048
4040.67
10458
1858
77,840
2386.95
10459
1397
39,080
3574.72
10460
1380
53,707
2569.49
10461
428
49,808
859.29
10462
1195
72,077
1657.95
10463
649
65,576
989.69
10464
66
4,634
1424.26
10465
322
42,500
757.65
10466
840
68,787
1221.16
10467
1555
94,342
1648.26
10468
1685
78,309
2151.73
10469
639
63,345
1008.76
10470
126
15,780
798.48
10471
80
23,413
341.69
10472
1497
64,867
2307.79
10473
1043
56,166
1856.99
10474
339
11,354
2985.73
10475
337
38,086
 
other/unkown
1113
 
 
Total
30709
1,332,650
2304.36


Text Box: This graph shows the cumulative AIDS rates by gender, race, and mode of transmission for the borough of the Bronx. Blacks, Hispanics, and males all have high cumulative AIDS rates (highlighted in green).


Text Box: Bronx County Male Population
Males with Aids
Cumulitive Aids Rate
620171
20348
3281.03


Bronx County Female Population
Females with Aids
 
712479
10361
1454.21


RACE
 
 
Black with AIDS
Black Population
Cumulitive Rate
13070
475007
2751.54
Hispanic with AIDS
Hispanic Population
Cumulitive Rate
15537
644705
2409.94
White with AIDS
White Population
Cumulitive Rate
1958
398003
491.96
Asian/ Pacific Islander with AIDS
Asian/Pacific Islander Population
Cumulitive Rate
90
41503
216.85
Native American with AIDS
Native American Population
Cumulitive Rate
10
11371
87.79
Other/Unkown with AIDS
Other/Unkown Population
Cumulitive Rate
44
329274
13.36


MODE OF TRANSMISSION
 
 
MSM
Population
Cumulitive Rate
4489
1332650
336.85
IDU
Population
 
15044
1332650
1128.88
Heterosexual
Population
 
4812
1332650
361.09
Perinatal
Population
 
673
1332650
50.5
Other
Population
 
167
1332650
12.53
Unknown
Population
 
5524
1332650
414.51


Text Box: This graph shows the cumulative AIDS rates for each borough in the Bronx. My zip code (highlighted in yellow) has a rate slightly higher than the total rate for the entire borough (highlighted in blue).


         *


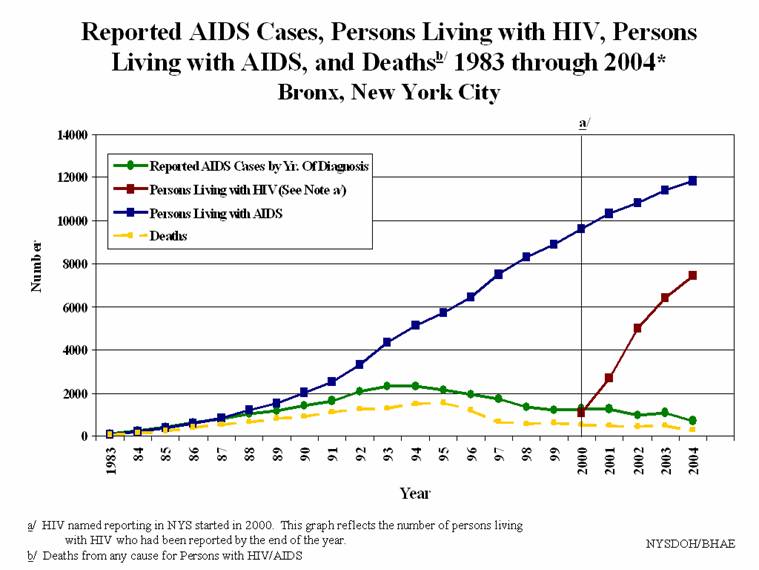
         This graph shows an overview of the entire population of people living with HIV/AIDS and deaths in the Bronx. It is worth recognizing that the number of people living with HIV/AIDS has significantly increased over the last 15 years due to advances and medicine and treatment.

                                *


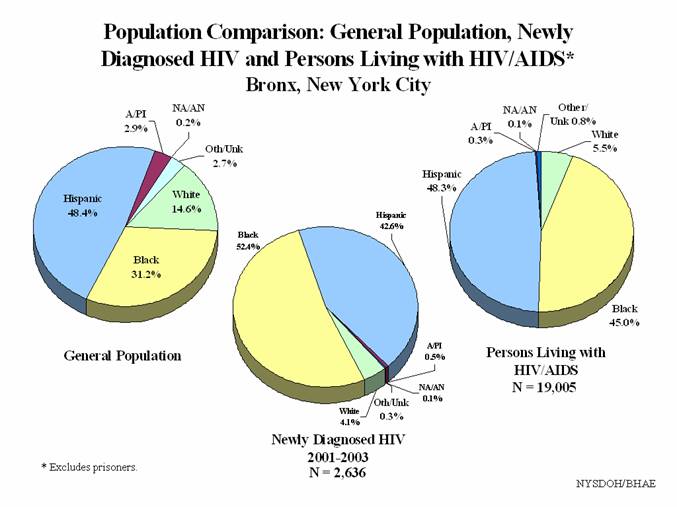
                  These pie graphs show the distribution of HIV/AIDS cases (by percent) in the Bronx among various races. My own observation plus research shows that there are more Hispanic people living in the Bronx so there are obviously more Hispanic people with HIV/AIDS. However, it is worth noting that Black cases of HIV/AIDS in the Bronx is increasing as shown in the newly diagnosed HIV. 


*Both graphs were taken from the New York State Department of Health Bureau of HIV/AIDS Epidemiology (linked on the bottom left side of the page)